Berkshire Hathaway (BRK-B) Q2 FY26 earnings
Revenue $101.8B, up 10% from a year ago. Net income $25.7B.
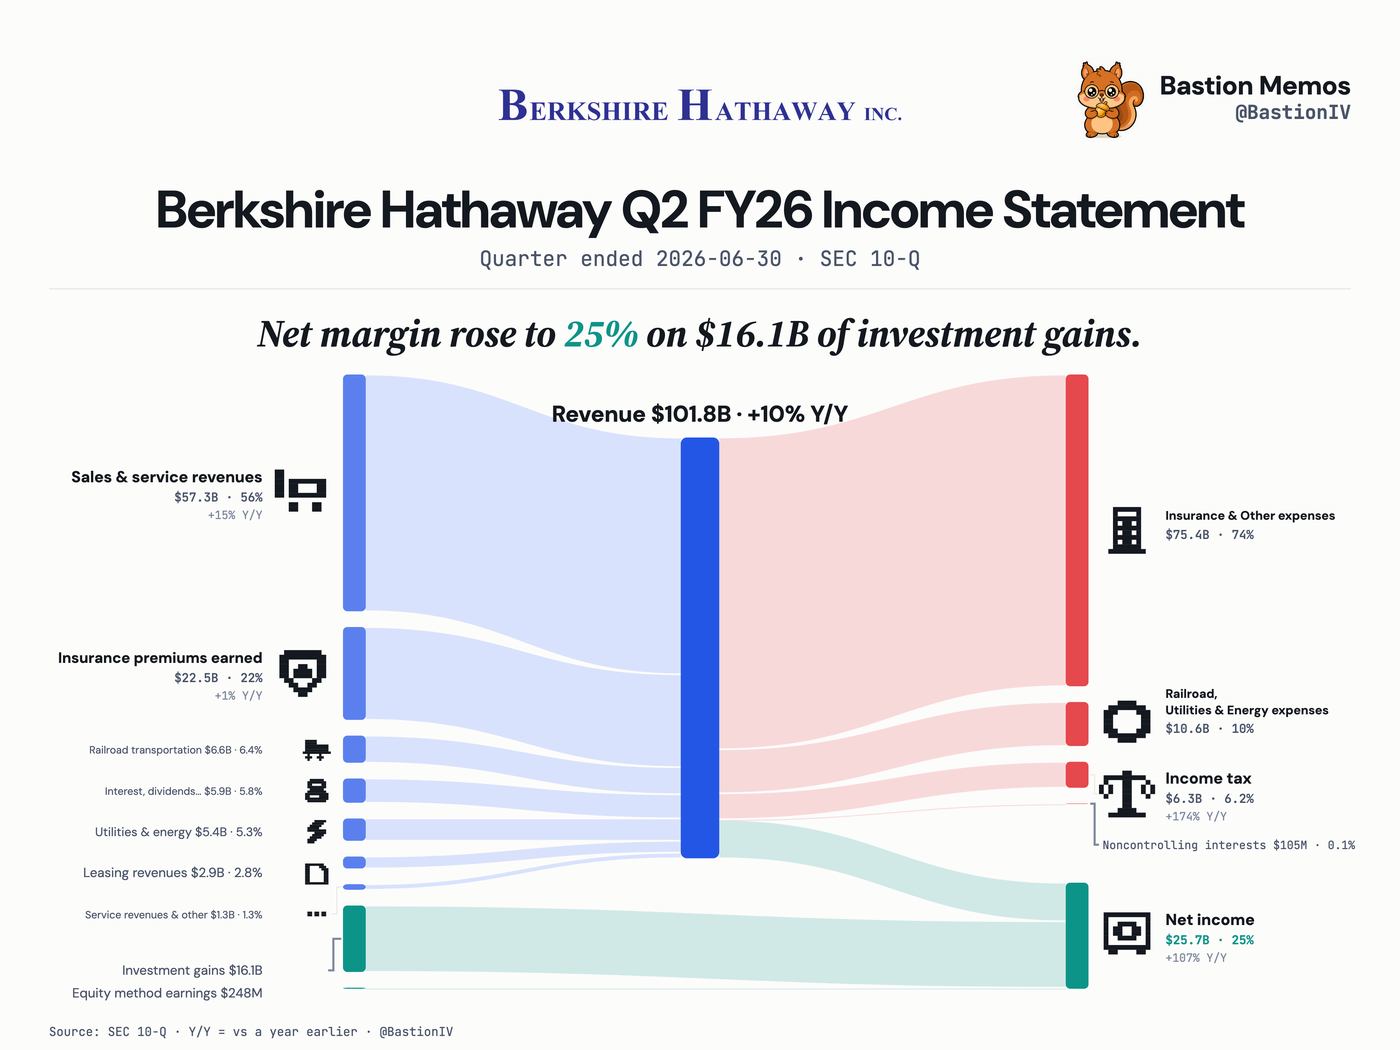
Berkshire Hathaway's quarter had $101.8B of revenue, up 10% from a year ago. Net income of $25.7B was 25% of revenue and includes $16.1B of investment gains.
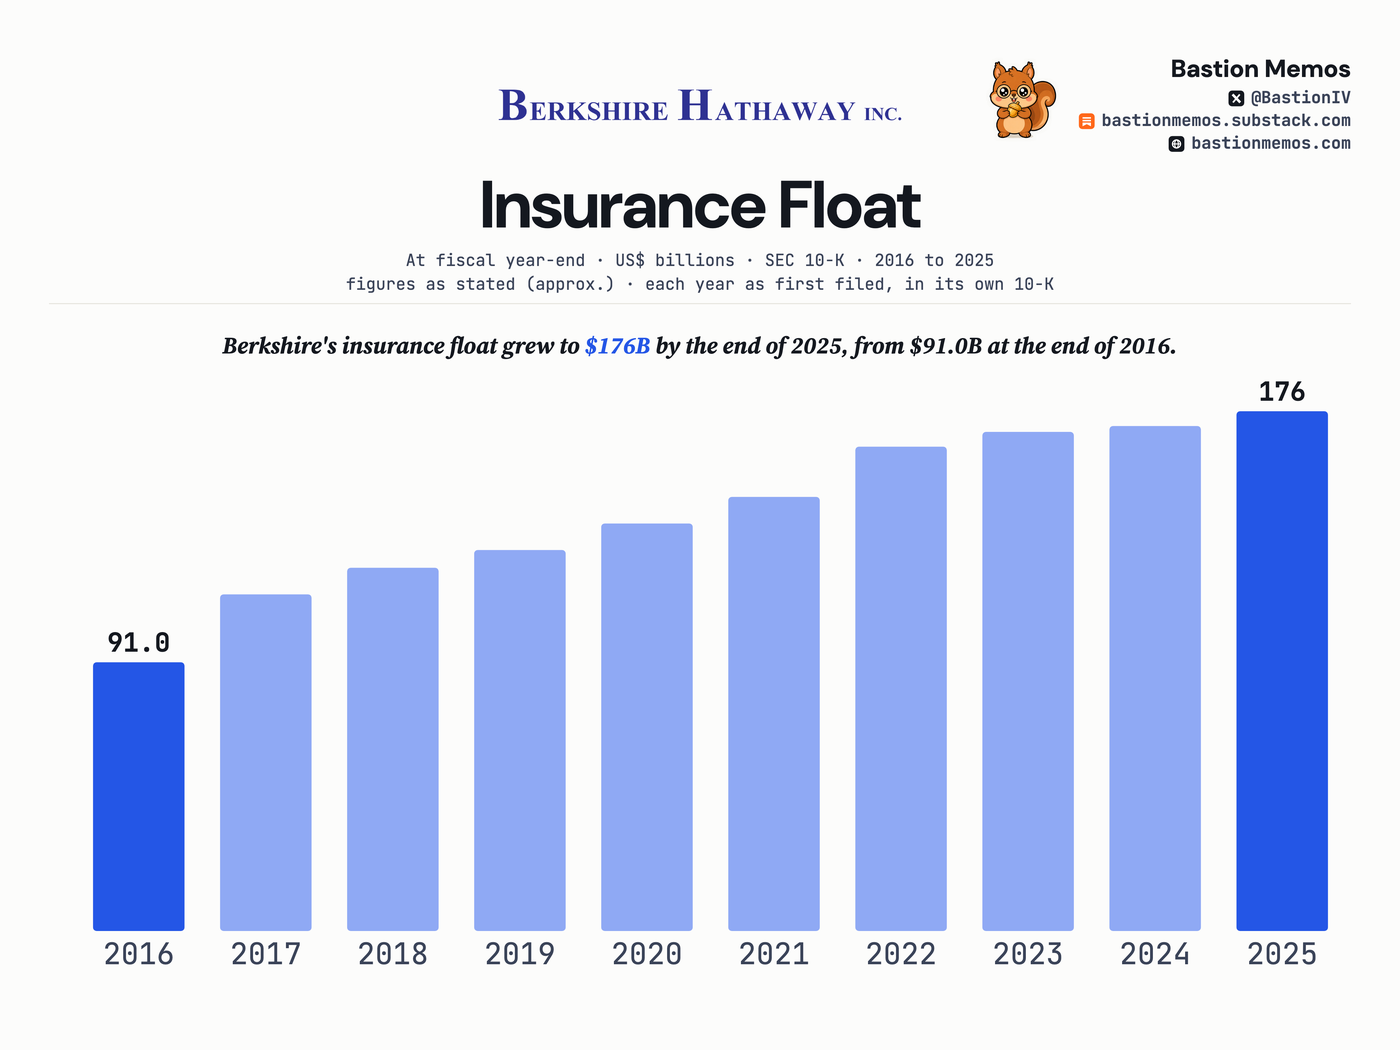
Berkshire's insurance float grew to $176B by the end of 2025, from $91.0B at the end of 2016.
Float is the premium money Berkshire holds before claims are paid, and the figure is stated once a year in the filer's own words. Values are as stated, approximate by the filer's own phrasing.
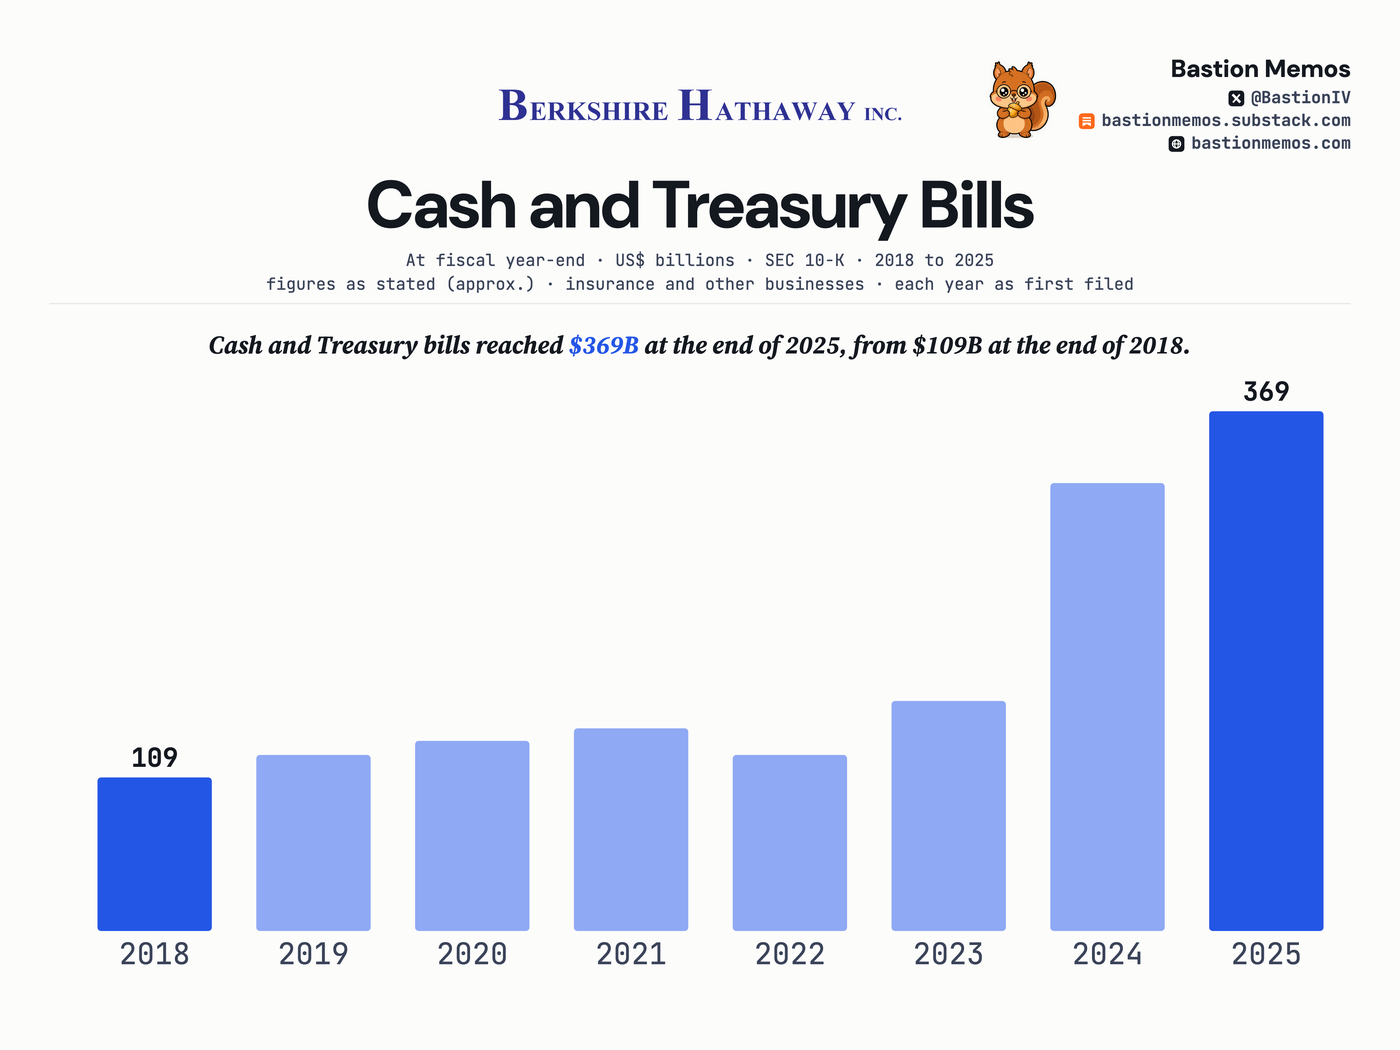
Cash and Treasury bills reached $369B at the end of 2025, from $109B at the end of 2018.
The scope is the insurance and other businesses, as the filer states it; railroad and utility cash sits outside. The span starts in 2018 because earlier years were restated on a different basis.
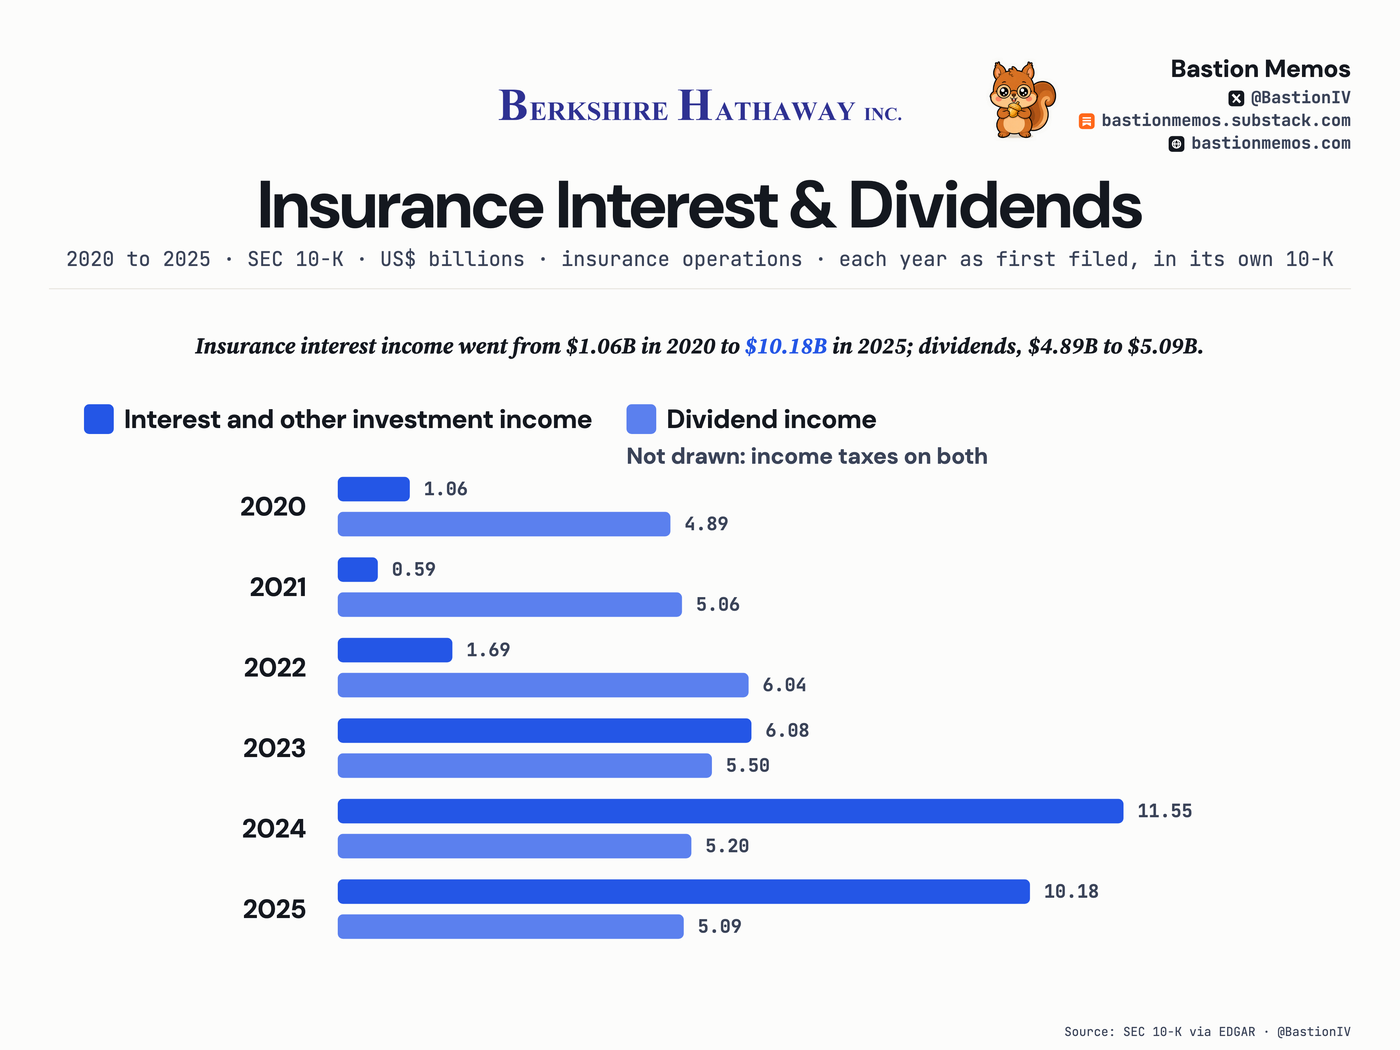
Insurance interest income went from $1.06B in 2020 to $10.18B in 2025; dividends, $4.89B to $5.09B.
Both rows are the filer's insurance-operations investment income, before income taxes. The filer notes late-2024 capital distributions moved earning assets out of this population.
Where the revenue came from
| Segment | Amount | % of revenue | Y/Y |
|---|---|---|---|
| Sales & service revenues | $57.3B | 56.3% | +15% |
| Insurance premiums earned | $22.5B | 22.1% | +1% |
| Railroad transportation | $6.6B | 6.4% | +15% |
| Interest, dividends & investments | $5.9B | 5.8% | -2% |
| Utilities & energy | $5.4B | 5.3% | +6% |
| Leasing revenues | $2.9B | 2.8% | +15% |
| Service revenues & other | $1.3B | 1.3% | +2% |
Income statement, line by line
| Line | Amount | % of revenue | Y/Y |
|---|---|---|---|
| Revenue | $101.8B | +10% | |
| Pretax income | $32.1B | 31.5% | — |
| Income tax | $6.3B | 6.2% | +174% |
| Net income | $25.7B | 25.2% | +107% |
— means the filing states no comparable prior-year figure for that line, so we do not compute one.
The filing also prints consolidated net income of $25.8B, of which $105M belongs to outside co-owners of Berkshire Hathaway's subsidiaries (noncontrolling interests, in the filing's words). The figures above are net income attributable to Berkshire Hathaway, the filer's own line.
Effective tax rate: 19.6%. That is tax as a share of pretax income. The 6.2% in the column above is tax as a share of revenue, which is not a tax rate.
The last 8 quarters
| Quarter ended | Revenue | Net income | Net margin |
|---|---|---|---|
| Jun 30, 2026 | $101.8B | $25.7B | 25.2% |
| Mar 31, 2026 | $93.7B | $10.1B | 10.8% |
| Dec 31, 2025 | $94.2B | $19.2B | 20.4% |
| Sep 30, 2025 | $95.0B | $30.8B | 32.4% |
| Jun 30, 2025 | $92.5B | $12.4B | 13.4% |
| Mar 31, 2025 | $89.7B | $4.6B | 5.1% |
| Dec 31, 2024 | $94.9B | $19.7B | 20.7% |
| Sep 30, 2024 | $93.0B | $26.3B | 28.2% |
Net income in this table includes investment gains and losses, realized and unrealized, as the accounting standard requires; they drive most of the quarter-to-quarter swing in the margin column. Berkshire's own reports say operating results are better read without them.
Held by tracked 13F managers
BERKSHIRE HATHAWAY INC DEL (CL B NEW): 22 of 69 tracked managers reported holding it — $10,905M across tracked reports, as filed.
13F reports arrive up to 45 days after quarter end and may be amended; totals sum across tracked reports, not unique economic ownership.
Get the next Berkshire Hathaway card when it files — free, one issue a week, no ratings. Subscribe on Substack.