Capital One (COF) Q2 FY26 earnings
Revenue $15.8B, up 27% from a year ago. Net income $3.0B.
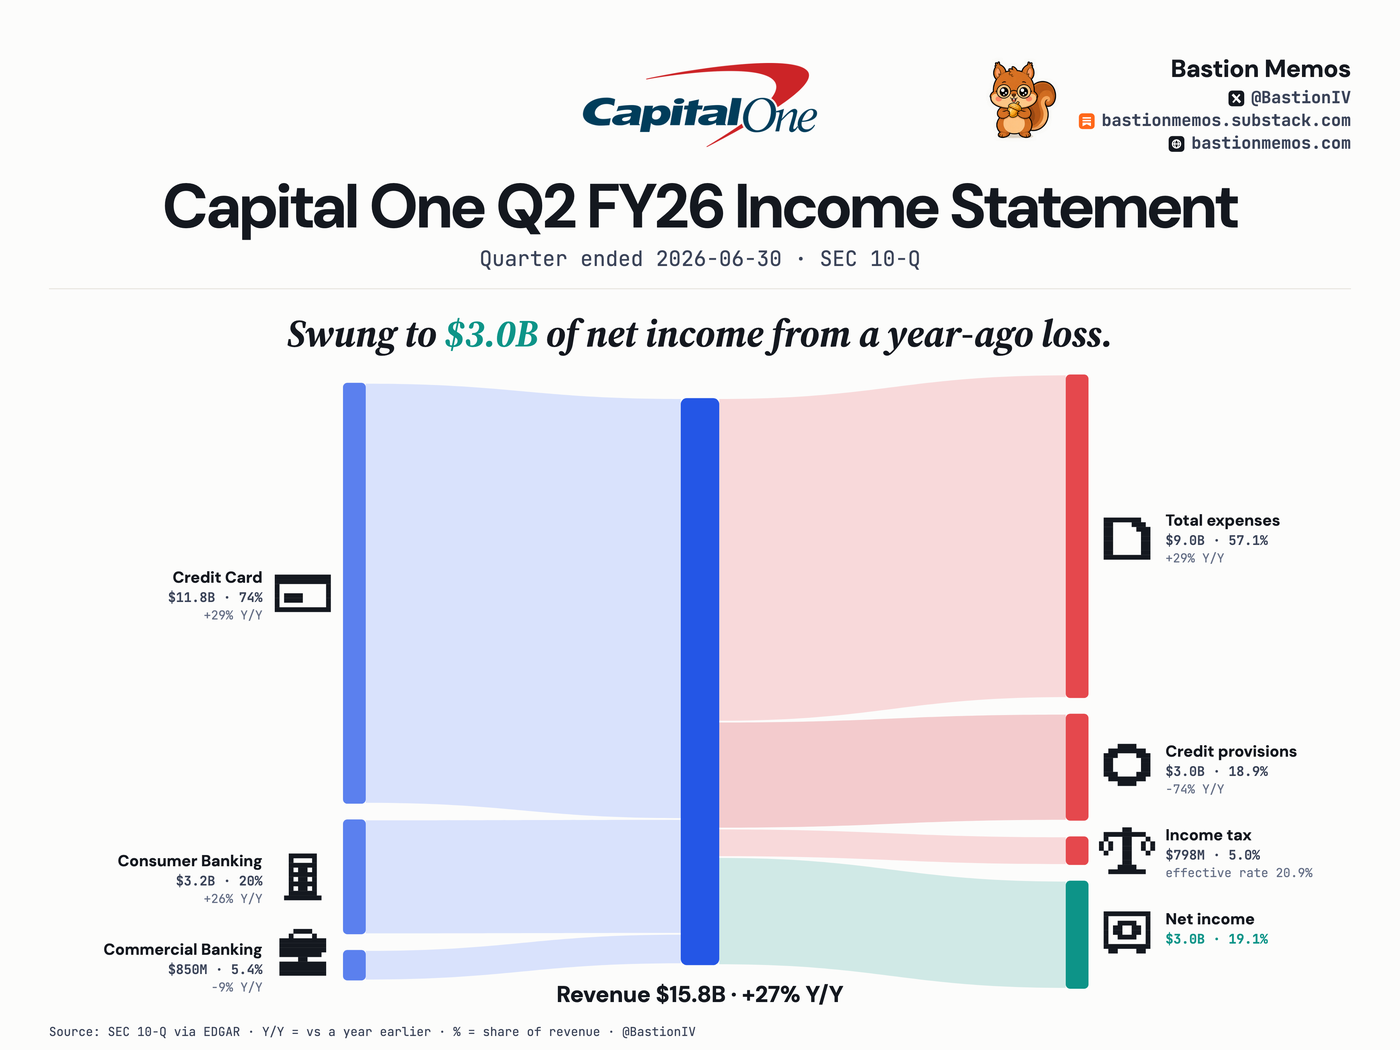
Capital One's quarter had $15.8B of revenue, up 27% from a year ago, with Credit Card at 74% of it. The quarter swung to $3.0B of net income from a year-ago loss.
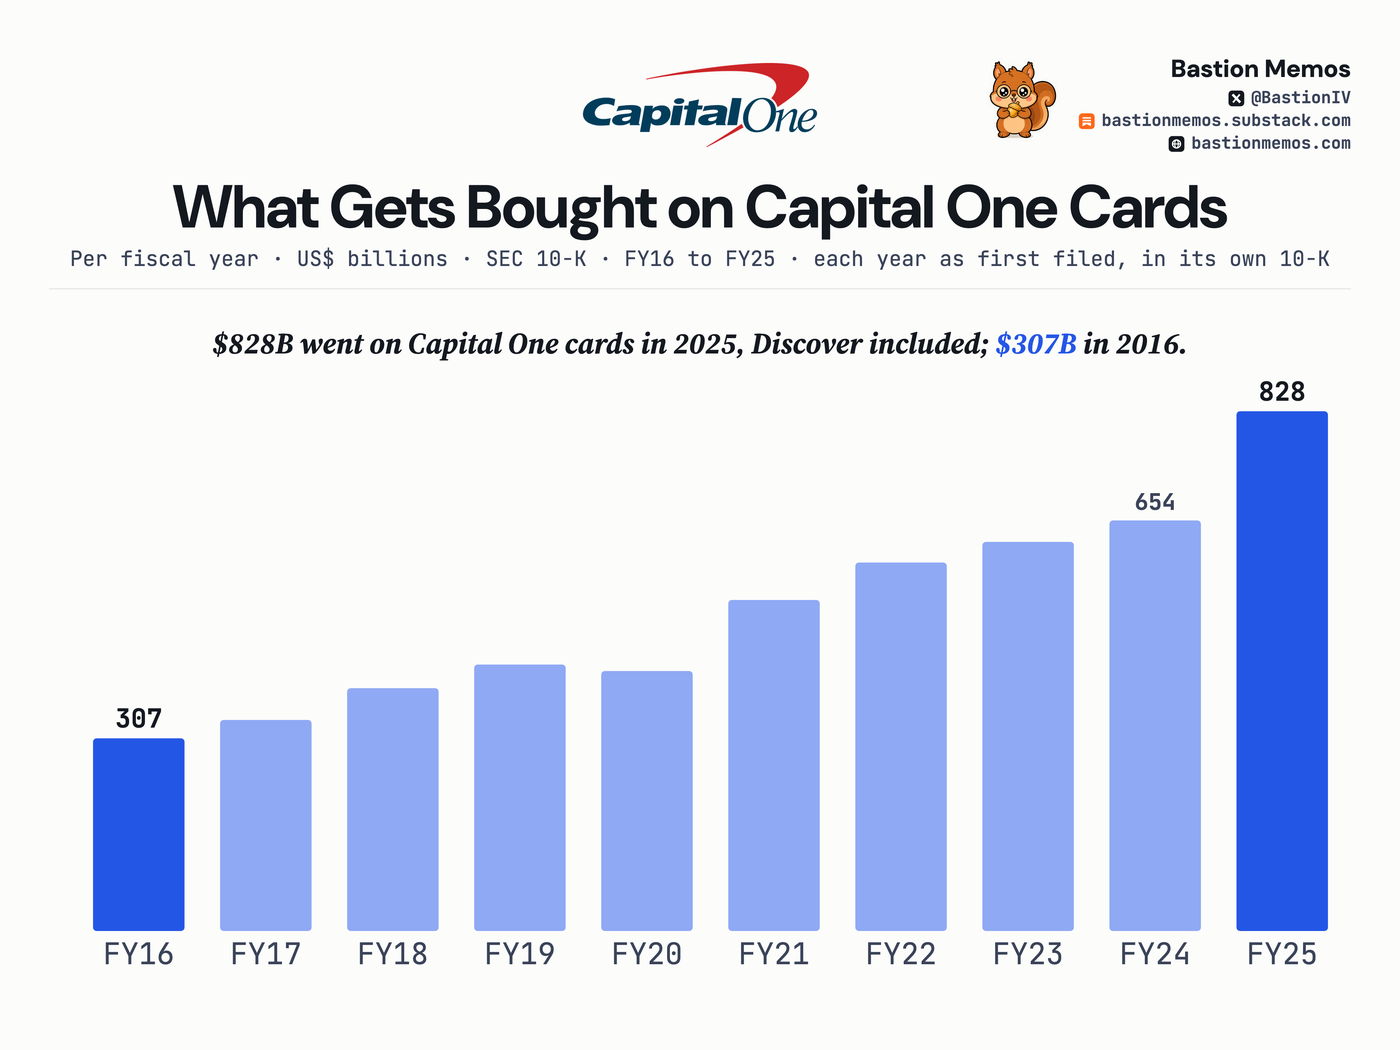
$828B went on Capital One cards in 2025, Discover included; $307B in 2016.
Purchase volume as the filer states it: purchases net of returns, excluding cash advances and balance transfers. Discover joined on the May 18, 2025 closing, so the last bar is a bigger company.
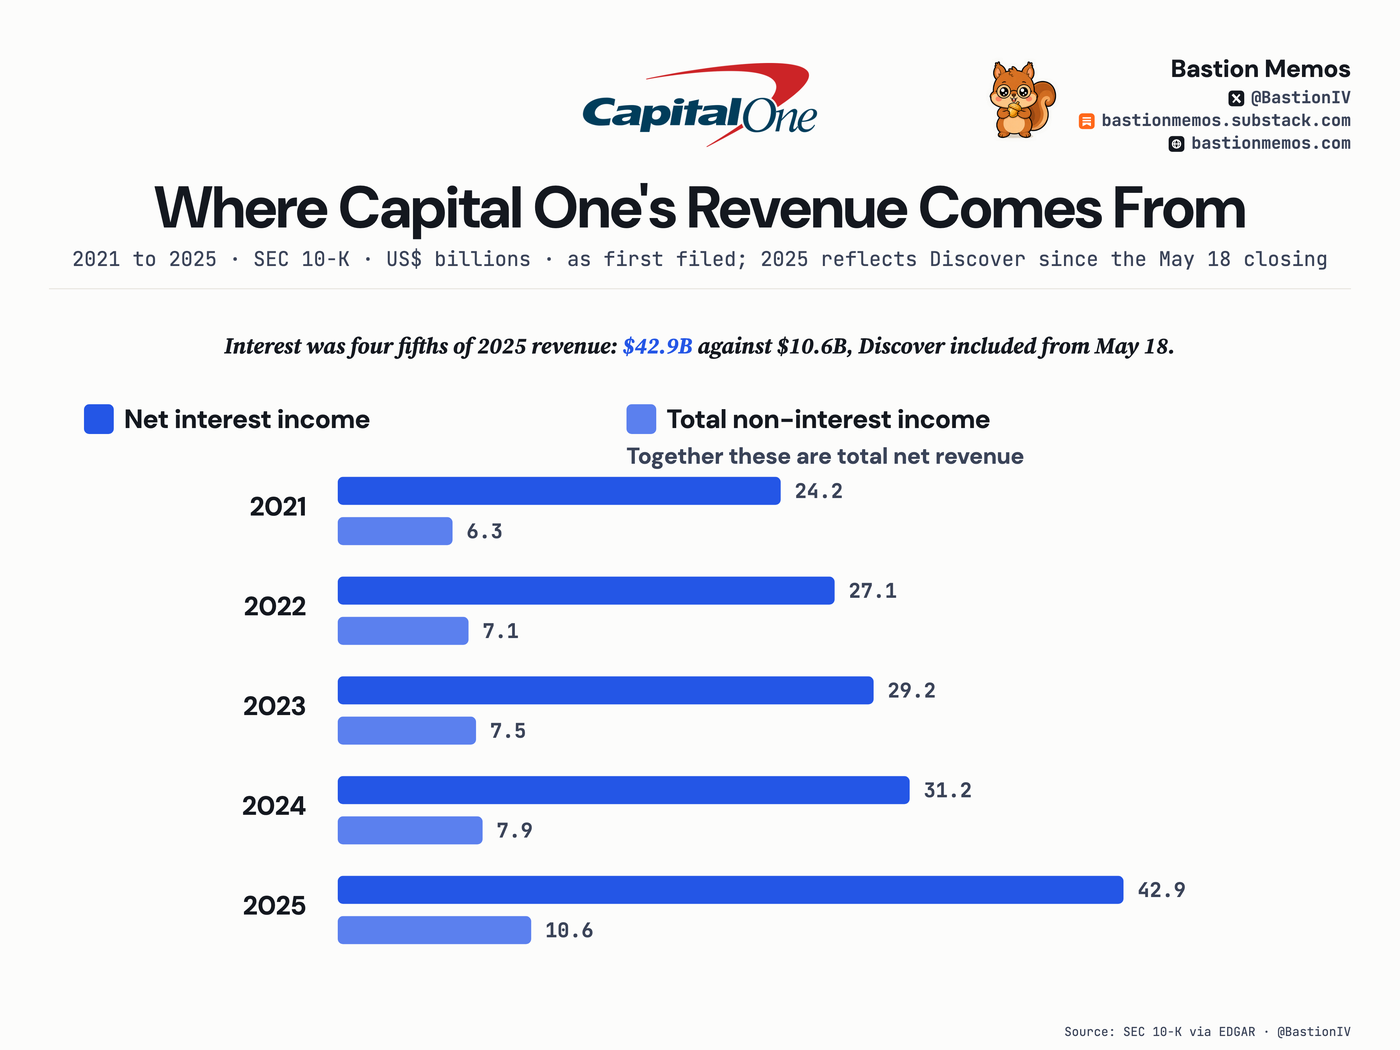
Interest was four fifths of 2025 revenue: $42.9B against $10.6B, Discover included from May 18.
The two halves are the filer's audited face lines and sum to its total net revenue exactly. The 2025 bars include Discover from the May 18 closing.
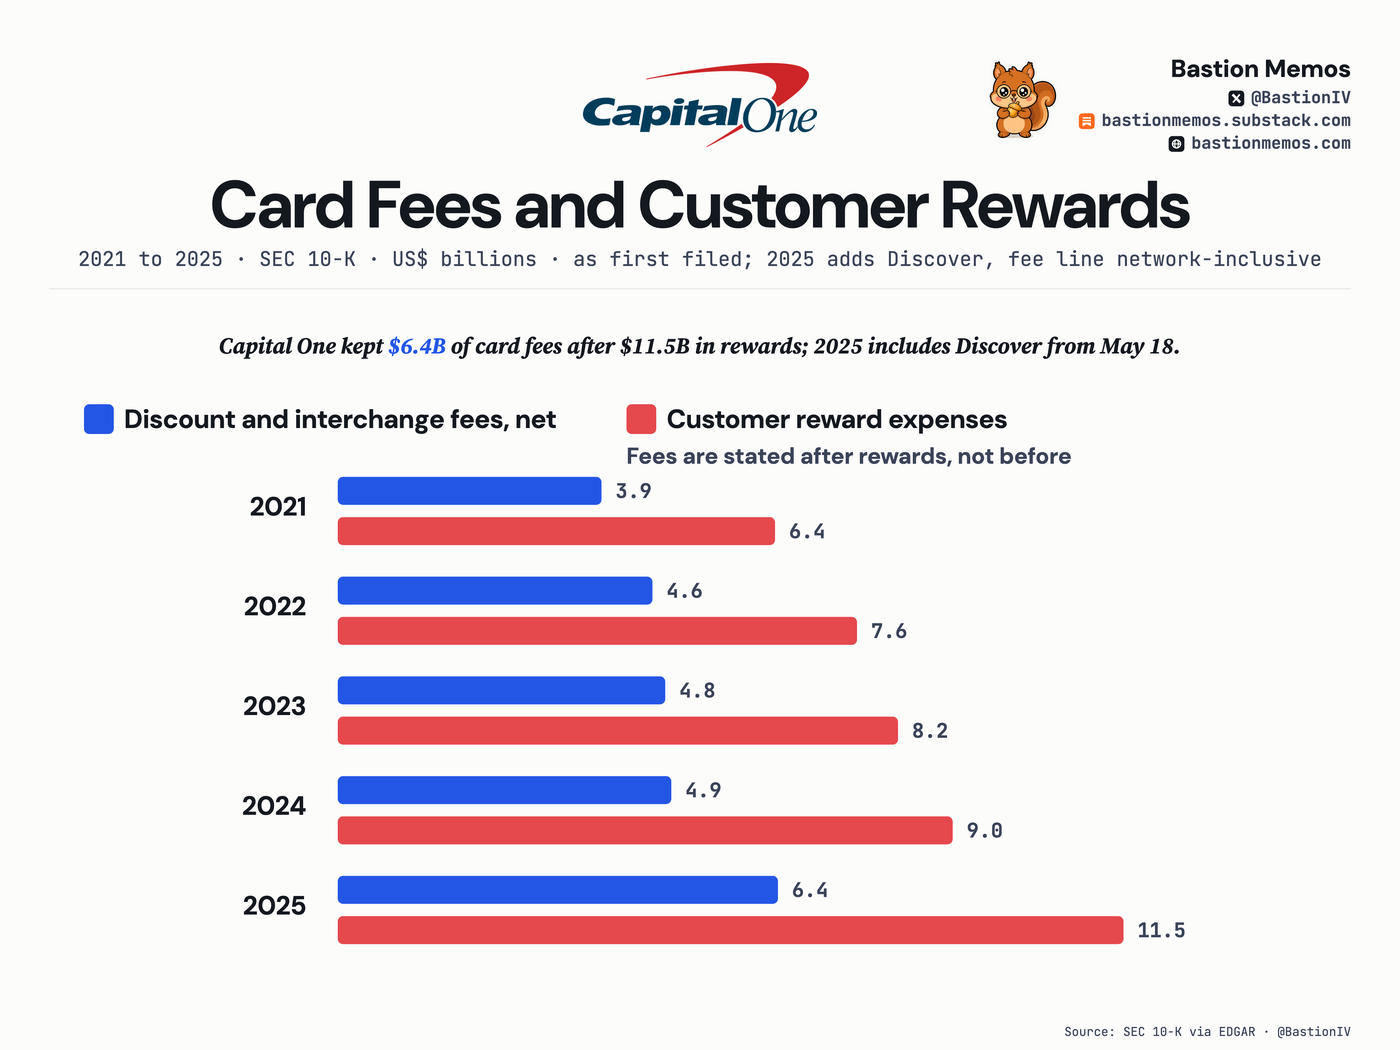
Capital One kept $6.4B of card fees after $11.5B in rewards; 2025 includes Discover from May 18.
Capital One reports its fee line after subtracting customer rewards, and the rewards are the larger number in every drawn year. Both figures come from the same netting in the filer's own note.
Where the revenue came from
| Segment | Amount | % of revenue | Y/Y |
|---|---|---|---|
| Credit Card | $11.8B | 74.3% | +29% |
| Consumer Banking | $3.2B | 20.3% | +26% |
| Commercial Banking | $850M | 5.4% | -9% |
Income statement, line by line
| Line | Amount | % of revenue | Y/Y |
|---|---|---|---|
| Revenue | $15.8B | +27% | |
| Pretax income | $3.8B | 24.1% | — |
| Income tax | $798M | 5.0% | — |
| Net income | $3.0B | 19.1% | — |
— means the filing states no comparable prior-year figure for that line, so we do not compute one.
Effective tax rate: 20.9%. That is tax as a share of pretax income. The 5.0% in the column above is tax as a share of revenue, which is not a tax rate.
The last 8 quarters
| Quarter ended | Revenue | Net income | Net margin |
|---|---|---|---|
| Jun 30, 2026 | $15.8B | $3.0B | 19.1% |
| Mar 31, 2026 | $15.2B | $2.2B | 14.3% |
| Dec 31, 2025 | $15.6B | $2.1B | 13.7% |
| Sep 30, 2025 | $15.4B | $3.2B | 20.8% |
| Jun 30, 2025 | $12.5B | ($4.3B) | (34.2%) |
| Mar 31, 2025 | $10.0B | $1.4B | 14.0% |
| Dec 31, 2024 | $10.2B | $1.1B | 10.8% |
| Sep 30, 2024 | $10.0B | $1.8B | 17.7% |
Held by tracked 13F managers
CAPITAL ONE FINL CORP (COM): 18 of 69 tracked managers reported holding it — $11,226M across tracked reports, as filed.
13F reports arrive up to 45 days after quarter end and may be amended; totals sum across tracked reports, not unique economic ownership.
Get the next Capital One card when it files — free, one issue a week, no ratings. Subscribe on Substack.