GE Vernova (GEV) Q2 FY26 earnings
Revenue $11.1B, up 22% from a year ago. Net income $668M.
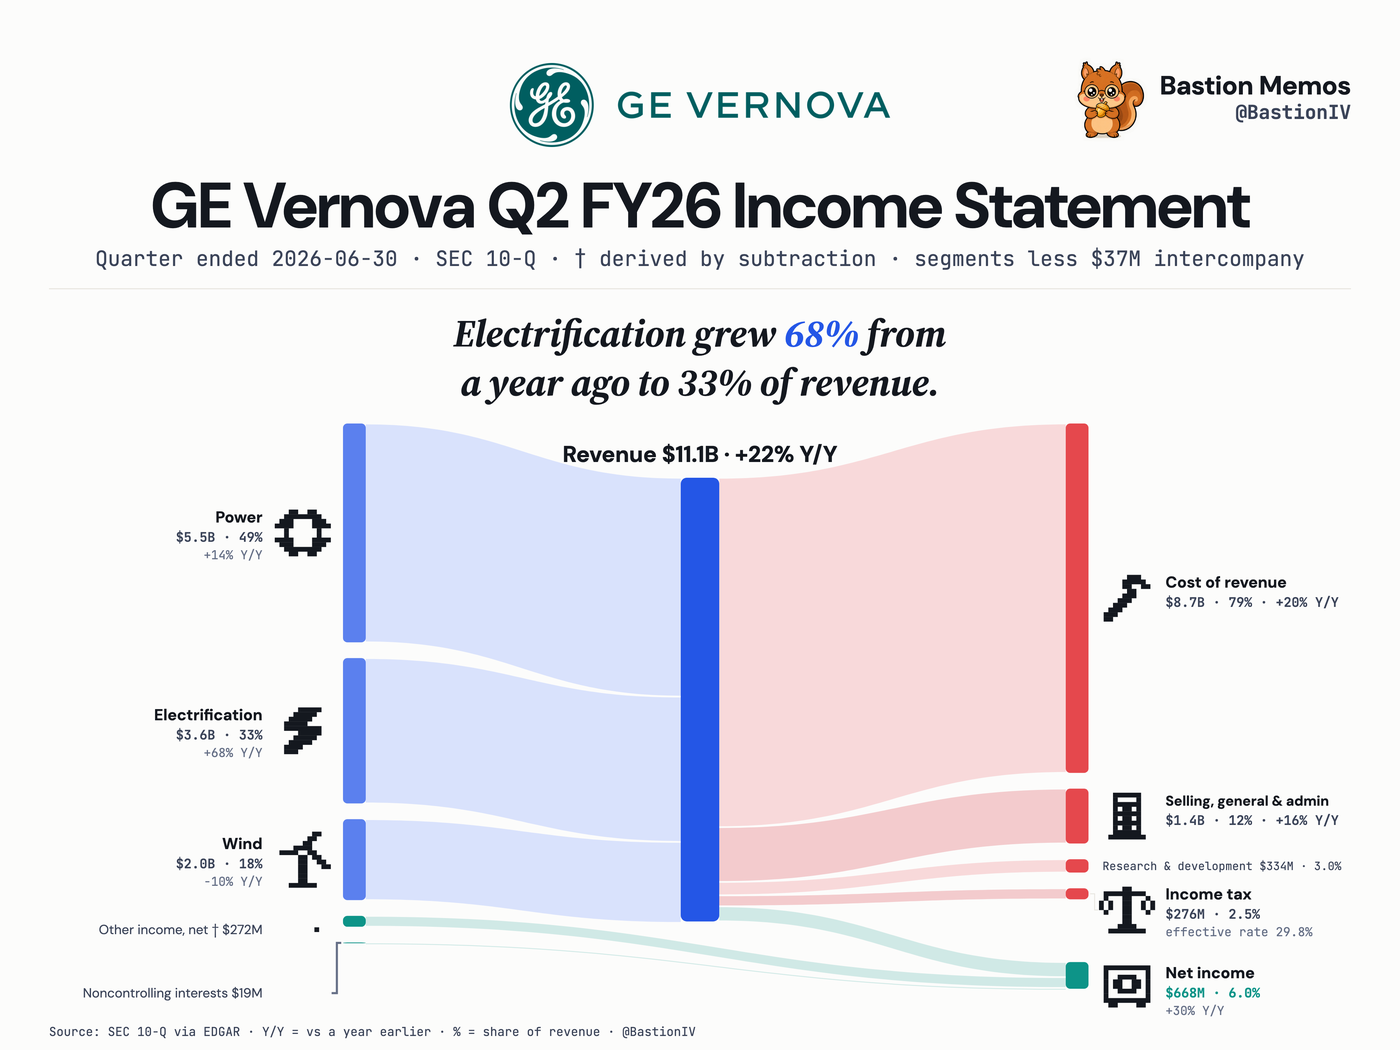
GE Vernova grew revenue 22% to $11.1B, with Electrification growing 68% to a third of the quarter. Net income was $668M — a 6.0% margin.
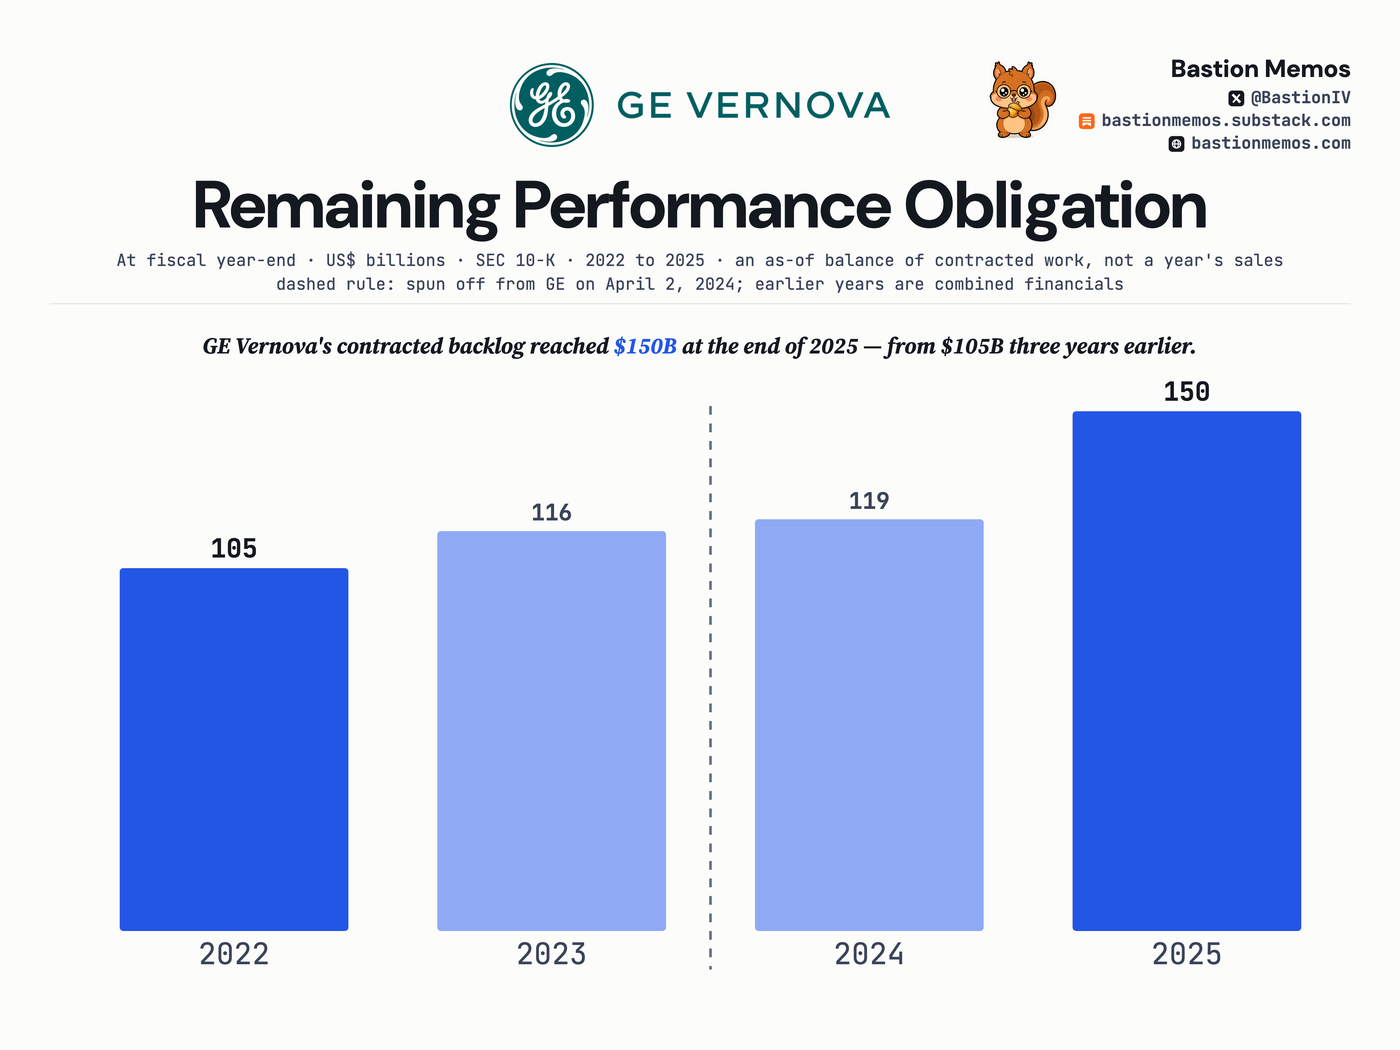
GE Vernova's contracted backlog reached $150B at the end of 2025 — from $105B three years earlier.
Total remaining performance obligation across the registrant's full 10-K record. The 2026 business realignment moved backlog between segments; the total is unchanged — which is why the total is what we draw. The dashed rule marks the April 2024 spin-off from GE.
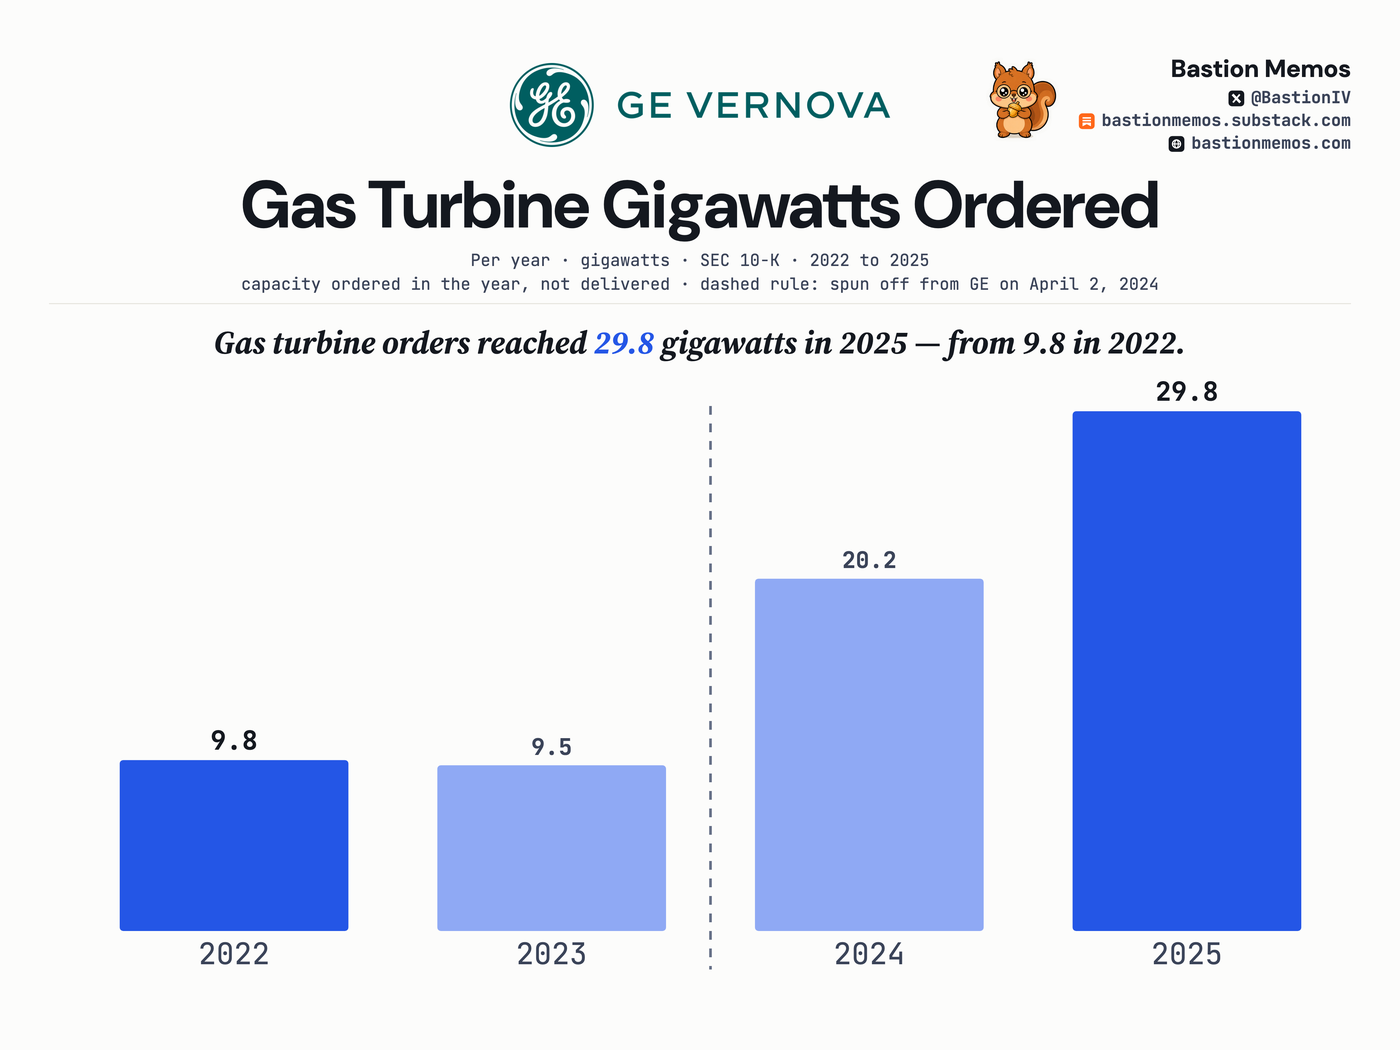
Gas turbine orders reached 29.8 gigawatts in 2025 — from 9.8 in 2022.
Capacity ordered in the year, not delivered: the order book tripled in two years while deliveries held near 12-15 gigawatts. The filer prints both tables; this card draws the orders row.
Where the revenue came from
| Segment | Amount | % of revenue | Y/Y |
|---|---|---|---|
| Power | $5.5B | 49.2% | +14% |
| Electrification | $3.6B | 32.6% | +68% |
| Wind | $2.0B | 18.2% | -10% |
Income statement, line by line
| Line | Amount | % of revenue | Y/Y |
|---|---|---|---|
| Revenue | $11.1B | +22% | |
| Cost of revenue | $8.7B | 78.7% | +20% |
| Gross profit | $2.4B | 21.3% | +28% |
| Operating expenses † | $1.7B | 15.4% | +16% |
| Operating income | $653M | 5.9% | +73% |
| Pretax income | $925M | 8.3% | — |
| Income tax | $276M | 2.5% | +80% |
| Net income | $668M | 6.0% | +30% |
— means the filing states no comparable prior-year figure for that line, so we do not compute one.
The filing also prints consolidated net income of $649M, of which -$19M belongs to outside co-owners of GE Vernova's subsidiaries (noncontrolling interests, in the filing's words). The figures above are net income attributable to GE Vernova, the filer's own line.
Effective tax rate: 29.8%. That is tax as a share of pretax income. The 2.5% in the column above is tax as a share of revenue, which is not a tax rate.
† The filing doesn't print this line. We calculated it from the filed figures; it adds up to the dollar.
The last 8 quarters
| Quarter ended | Revenue | Net income | Net margin |
|---|---|---|---|
| Jun 30, 2026 | $11.1B | $668M | 6.0% |
| Mar 31, 2026 | $9.3B | $4.8B | 50.9% |
| Dec 31, 2025 | $11.0B | $3.7B | 33.5% |
| Sep 30, 2025 | $10.0B | $452M | 4.5% |
| Jun 30, 2025 | $9.1B | $514M | 5.6% |
| Mar 31, 2025 | $8.0B | $264M | 3.3% |
| Dec 31, 2024 | $10.6B | $484M | 4.6% |
| Sep 30, 2024 | $8.9B | ($96M) | (1.1%) |
Held by tracked 13F managers
GE VERNOVA INC COM: 14 of 69 tracked managers reported holding it — $9,319M across tracked reports, as filed.
13F reports arrive up to 45 days after quarter end and may be amended; totals sum across tracked reports, not unique economic ownership.
Get the next GE Vernova card when it files — free, one issue a week, no ratings. Subscribe on Substack.