Merck (MRK) Q2 FY26 earnings
Revenue $16.6B, up 5% from a year ago. Net loss $1.3B.
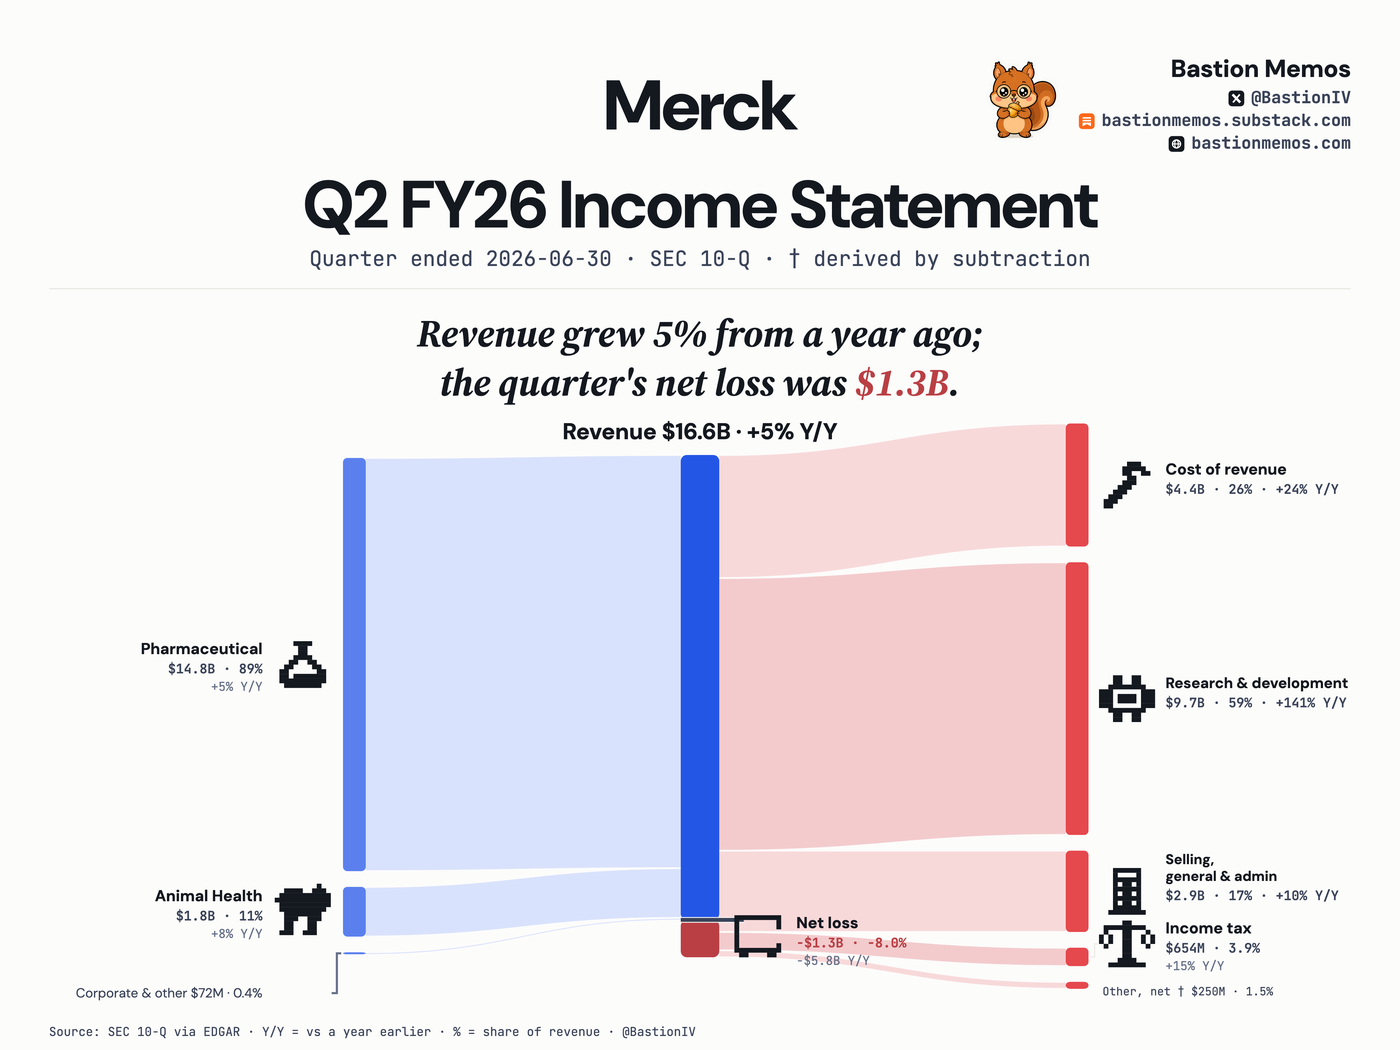
Merck's quarter had $16.6B of revenue, up 5% from a year ago, with Pharmaceutical at 89% of it. The quarter closed at a net loss of $1.3B — a swing of $5.8B against last year.
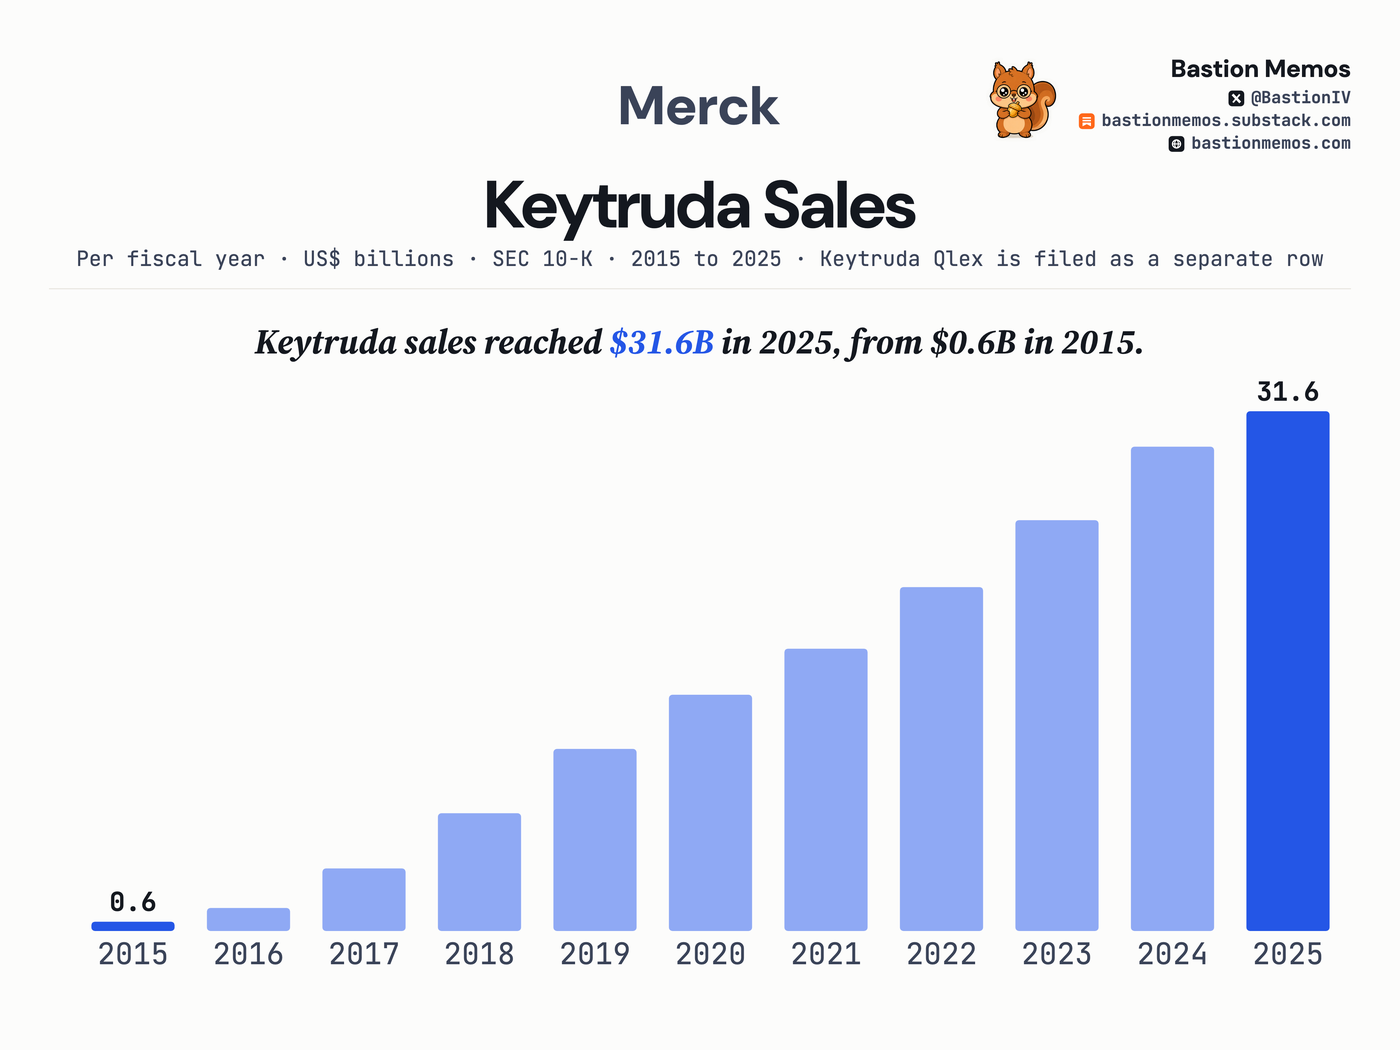
Keytruda sales reached $31.6B in 2025, from $0.6B in 2015.
Eleven years of one product row, never restated in any filing — it crosses the Organon spin-off untouched because Merck restated its totals, not its retained products. The filer's own sentence: in 2025 Keytruda was 49% of the company's total sales.
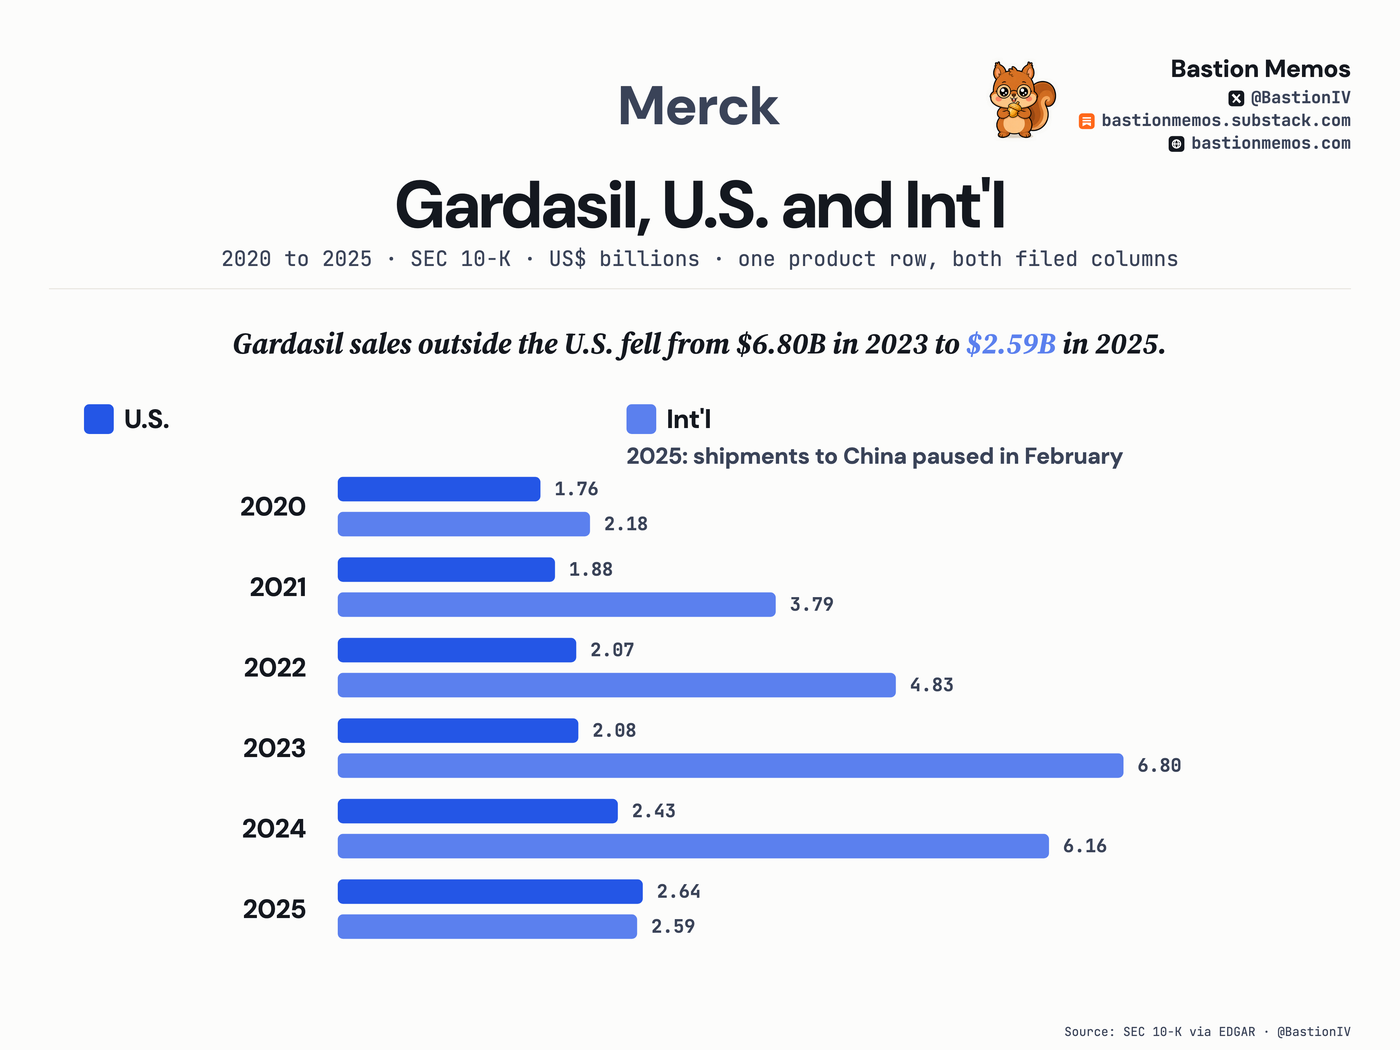
Gardasil sales outside the U.S. fell from $6.80B in 2023 to $2.59B in 2025.
The same vaccine, two directions: U.S. sales climbed every drawn year while international sales — mostly the China channel — gave back most of their rise. Both columns are the filer's own product-geography rows.
Where the revenue came from
| Segment | Amount | % of revenue | Y/Y |
|---|---|---|---|
| Pharmaceutical | $14.8B | 89.3% | +5% |
| Animal Health | $1.8B | 10.7% | +8% |
Income statement, line by line
| Line | Amount | % of revenue | Y/Y |
|---|---|---|---|
| Revenue | $16.6B | +5% | |
| Cost of revenue | $4.4B | 26.5% | +24% |
| Gross profit † | $12.2B | 73.5% | -0% |
| Pretax income | -$683M | -4.1% | — |
| Income tax | $654M | 3.9% | +15% |
| Net income | -$1.3B | -8.0% | -130% |
— means the filing states no comparable prior-year figure for that line, so we do not compute one.
The filing also prints consolidated net income of -$1.3B, of which -$2M belongs to outside co-owners of Merck's subsidiaries (noncontrolling interests, in the filing's words). The figures above are net income attributable to Merck, the filer's own line.
† The filing doesn't print this line. We calculated it from the filed figures; it adds up to the dollar.
The last 8 quarters
| Quarter ended | Revenue | Net income | Net margin |
|---|---|---|---|
| Jun 30, 2026 | $16.6B | ($1.3B) | (8.0%) |
| Mar 31, 2026 | $16.3B | ($4.2B) | (26.0%) |
| Dec 31, 2025 | $16.4B | $3.0B | 18.1% |
| Sep 30, 2025 | $17.3B | $5.8B | 33.5% |
| Jun 30, 2025 | $15.8B | $4.4B | 28.0% |
| Mar 31, 2025 | $15.5B | $5.1B | 32.7% |
| Dec 31, 2024 | $15.6B | $3.7B | 24.0% |
| Sep 30, 2024 | $16.7B | $3.2B | 19.0% |
Held by tracked 13F managers
MERCK CO INC (COM): 14 of 69 tracked managers reported holding it — $6,965M across tracked reports, as filed.
13F reports arrive up to 45 days after quarter end and may be amended; totals sum across tracked reports, not unique economic ownership.
Get the next Merck card when it files — free, one issue a week, no ratings. Subscribe on Substack.