Marvell Technology (MRVL) Q2 FY27 earnings
Revenue $2.7B, up 37% from a year ago. Net income $308M.
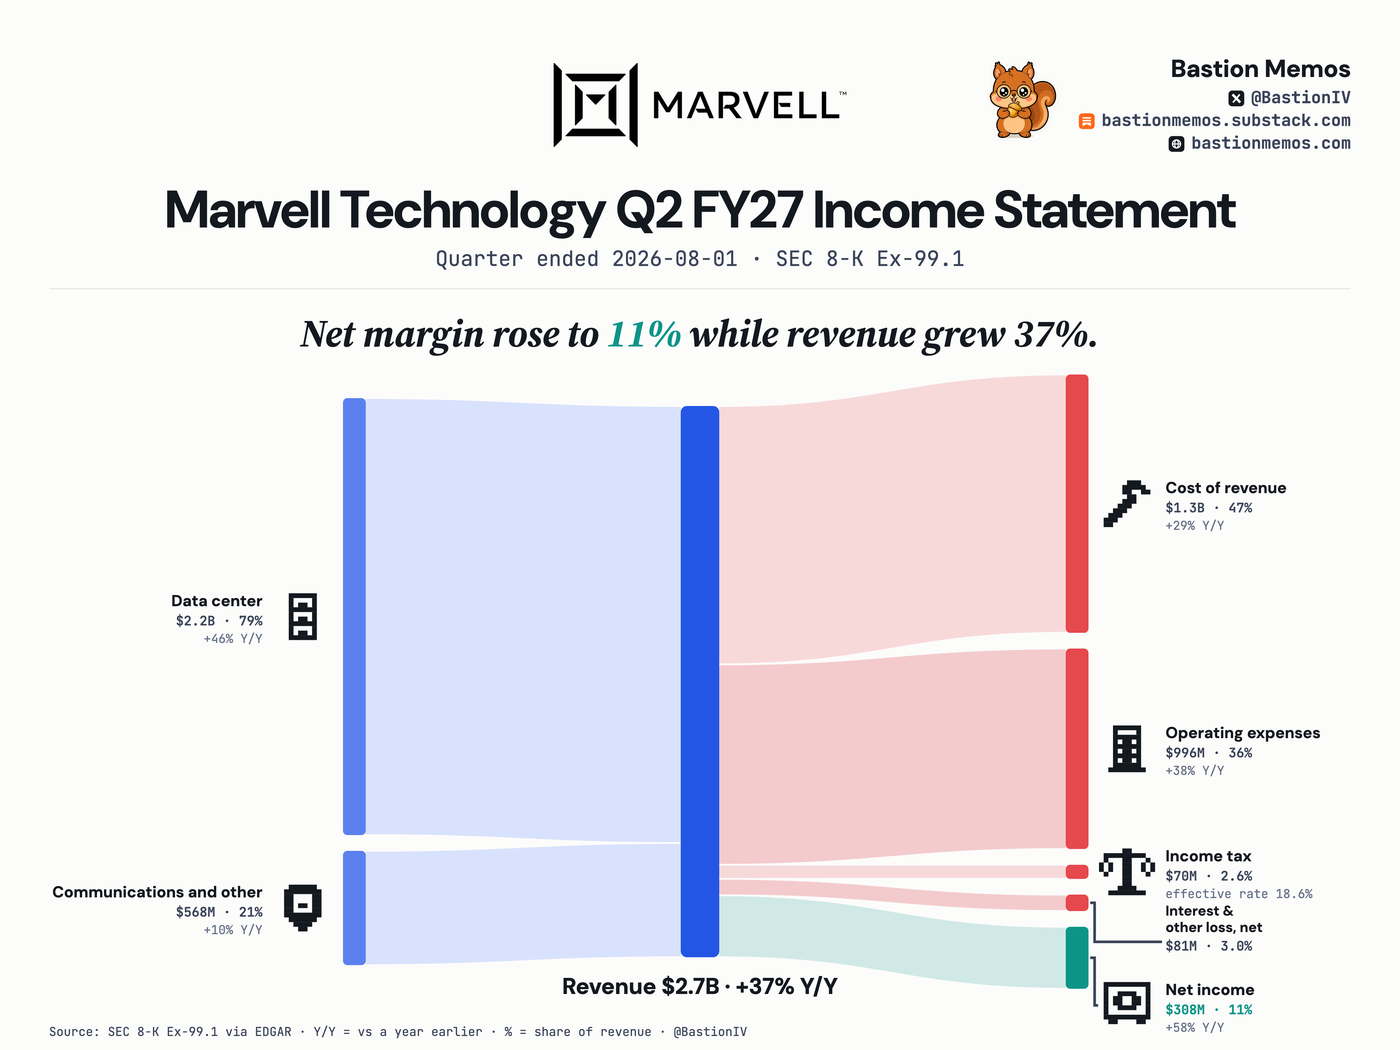
A guide-heavy week for Marvell ended with this on record: revenue $2.7B, up 37%, with data center at $2.2B — 79% of the company, up 46%. Net income was $308M, an 11% margin.
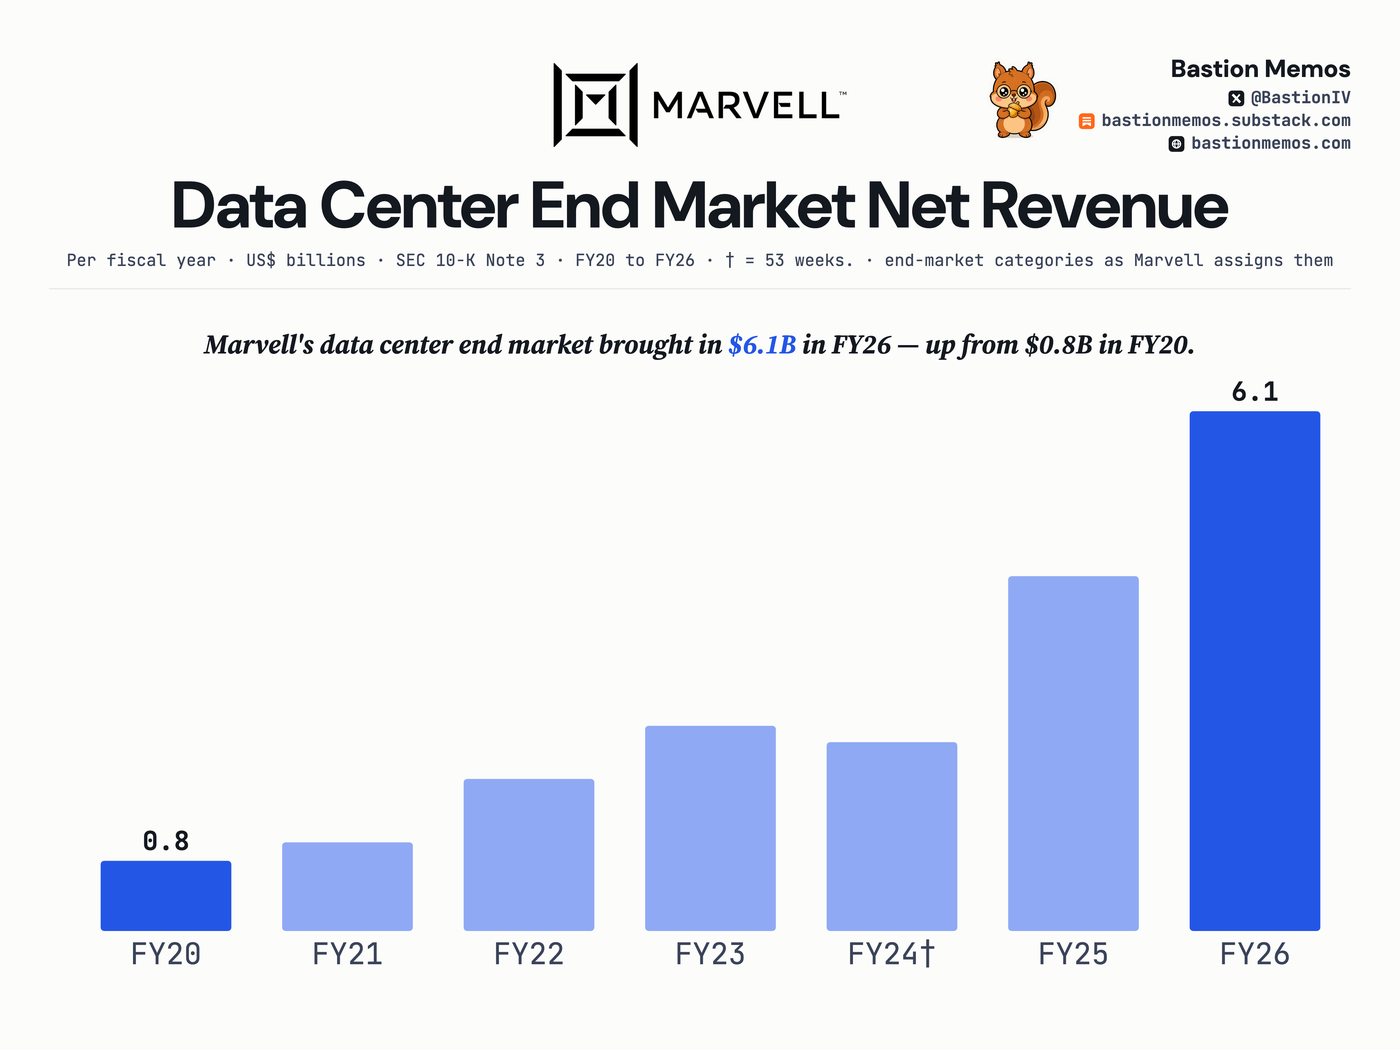
Marvell's data center end market brought in $6.1B in FY26 — up from $0.8B in FY20.
The filer's own data-center row across the drawn years. This is the line the market watches, stated as filed.
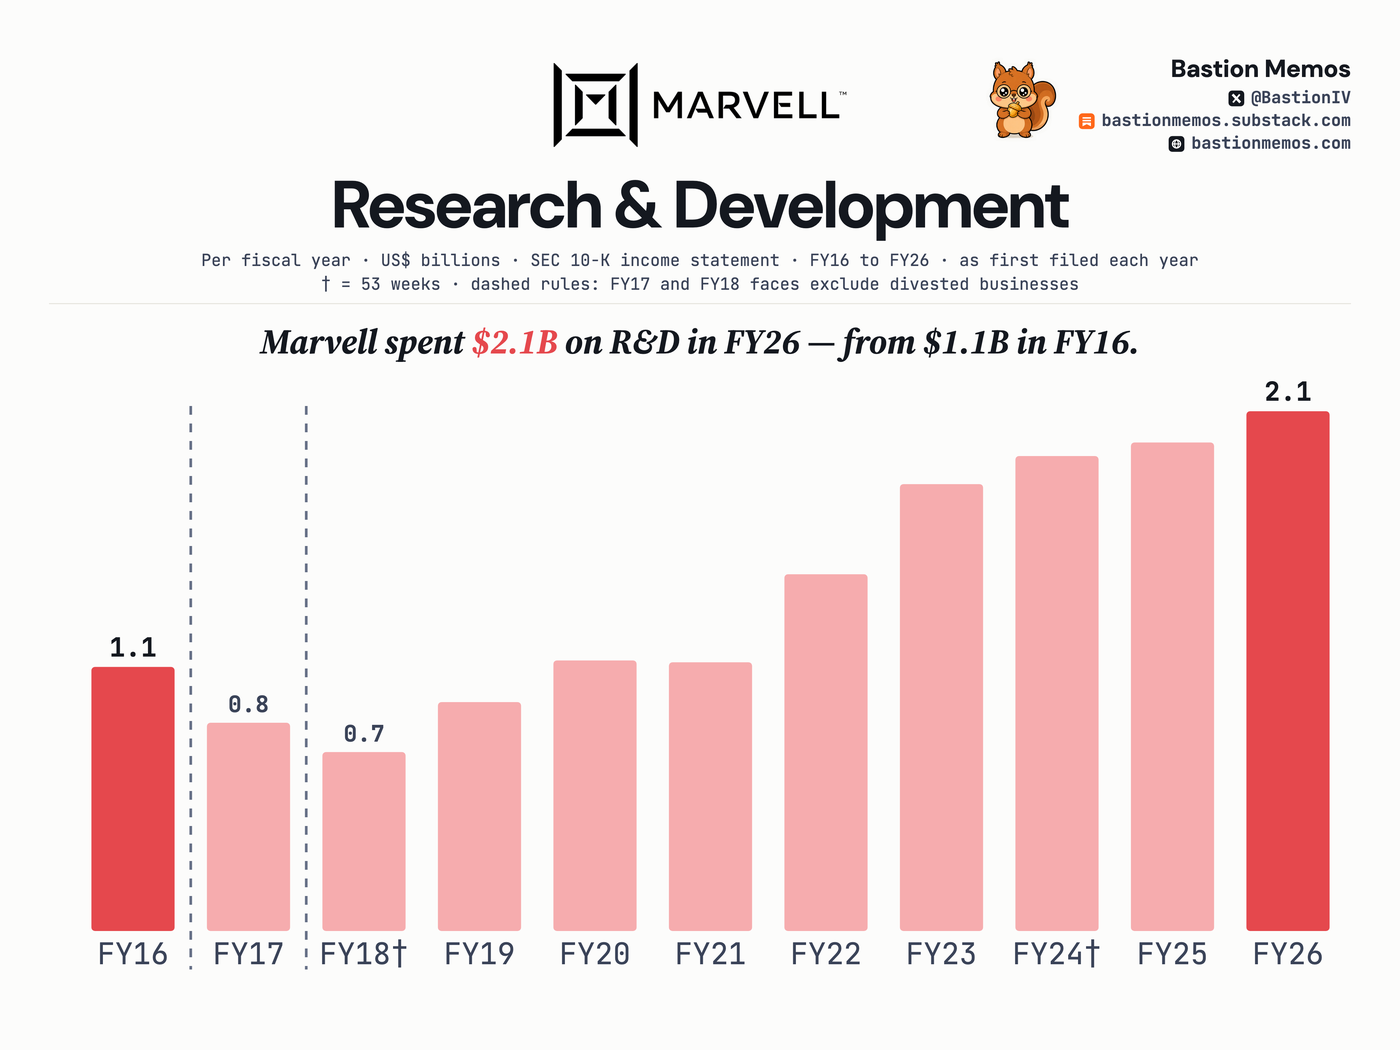
Marvell spent $2.1B on R&D in FY26 — from $1.1B in FY16.
Research and development as the filings state it, year by year, beside the revenue it serves.
Where the revenue came from
| Segment | Amount | % of revenue | Y/Y |
|---|---|---|---|
| Data center | $2.2B | 79.3% | +46% |
| Communications and other | $568M | 20.7% | +10% |
As Marvell Technology's own segment table reports it.
Income statement, line by line
| Line | Amount | % of revenue | Y/Y |
|---|---|---|---|
| Revenue | $2.7B | +37% | |
| Cost of revenue | $1.3B | 46.9% | +29% |
| Gross profit | $1.5B | 53.1% | +44% |
| Operating expenses | $996M | 36.4% | +38% |
| Operating income | $460M | 16.8% | +58% |
| Pretax income | $378M | 13.8% | +62% |
| Income tax | $70M | 2.6% | +81% |
| Net income | $308M | 11.2% | +58% |
— means the filing states no comparable prior-year figure for that line, so we do not compute one.
Effective tax rate: 18.6%. That is tax as a share of pretax income. The 2.6% in the column above is tax as a share of revenue, which is not a tax rate.
The last 8 quarters
| Quarter ended | Revenue | Net income | Net margin |
|---|---|---|---|
| Aug 1, 2026 | $2.7B | $308M | 11.2% |
| May 2, 2026 | $2.4B | $34M | 1.4% |
| Jan 31, 2026 | $2.2B | $396M | 17.9% |
| Nov 1, 2025 | $2.1B | $1.9B | 91.7% |
| Aug 2, 2025 | $2.0B | $195M | 9.7% |
| May 3, 2025 | $1.9B | $178M | 9.4% |
| Feb 1, 2025 | $1.8B | $200M | 11.0% |
| Nov 2, 2024 | $1.5B | ($676M) | (44.6%) |
Held by tracked 13F managers
MARVELL TECHNOLOGY INC (COM): 7 of 69 tracked managers reported holding it — $280M across tracked reports, as filed.
13F reports arrive up to 45 days after quarter end and may be amended; totals sum across tracked reports, not unique economic ownership.
Get the next Marvell Technology card when it files — free, one issue a week, no ratings. Subscribe on Substack.