Nvidia (NVDA) Q2 FY27 earnings
Revenue $96.2B, up 106% from a year ago. Net income $59.7B.
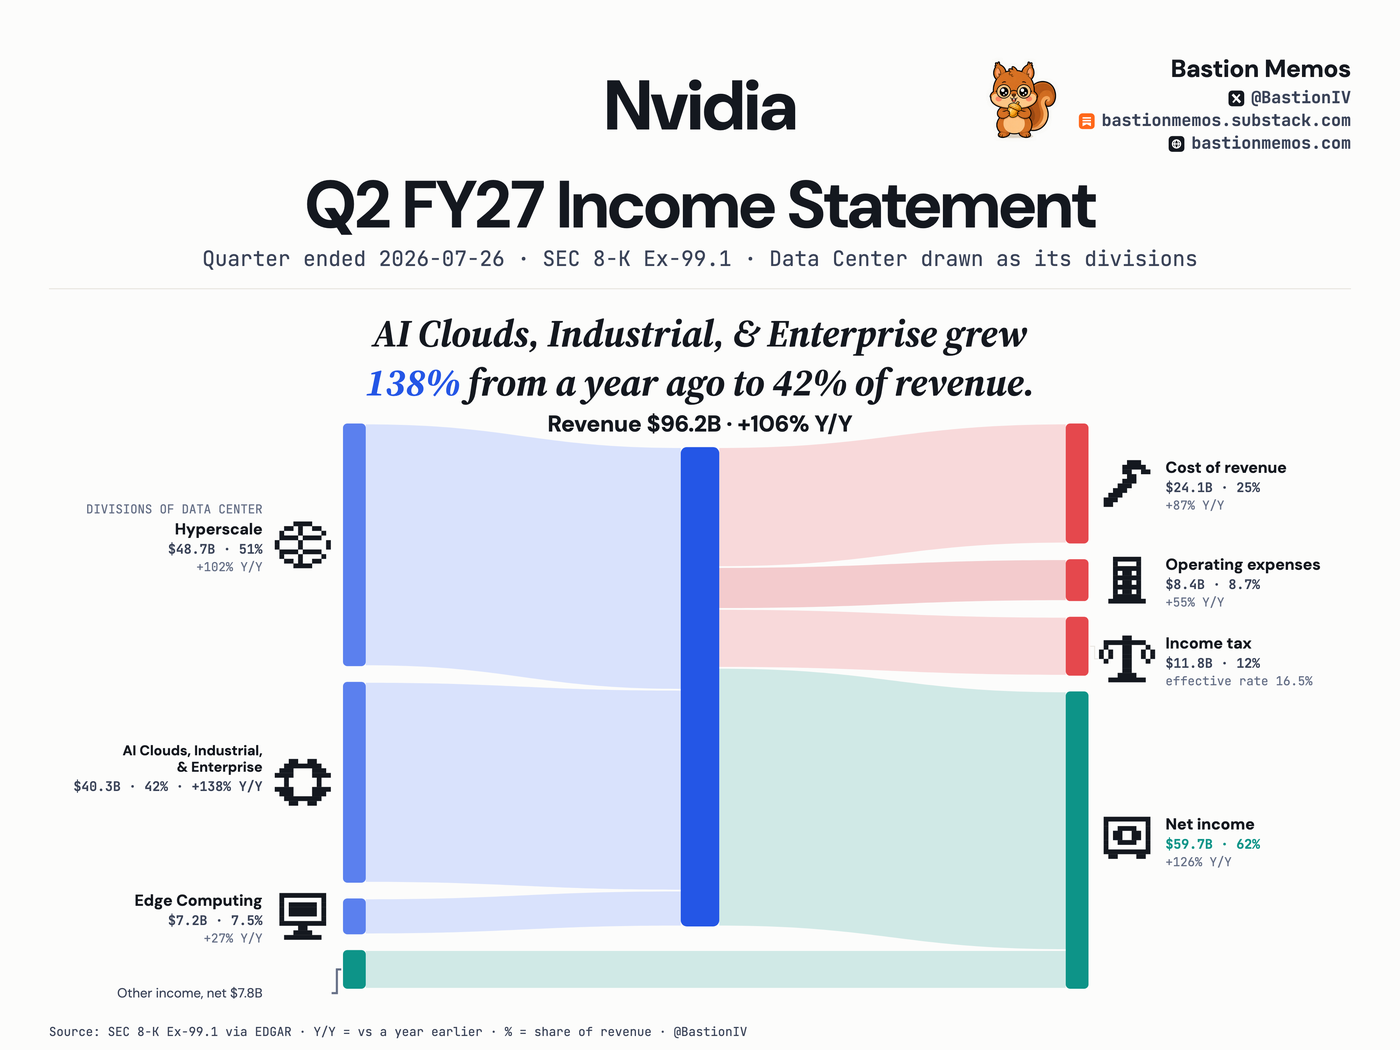
Revenue doubled — up 106% — to $96.2B, and net income reached $59.7B, 62 cents of each revenue dollar. The drawn split is the filer's own new basis: Hyperscale, 51% of revenue, and AI Clouds, Industrial, & Enterprise, which grew 138% to 42%. Off the income statement, one more number from the CFO commentary: commitments of $279 billion, from $119 billion, primarily for memory procurement.
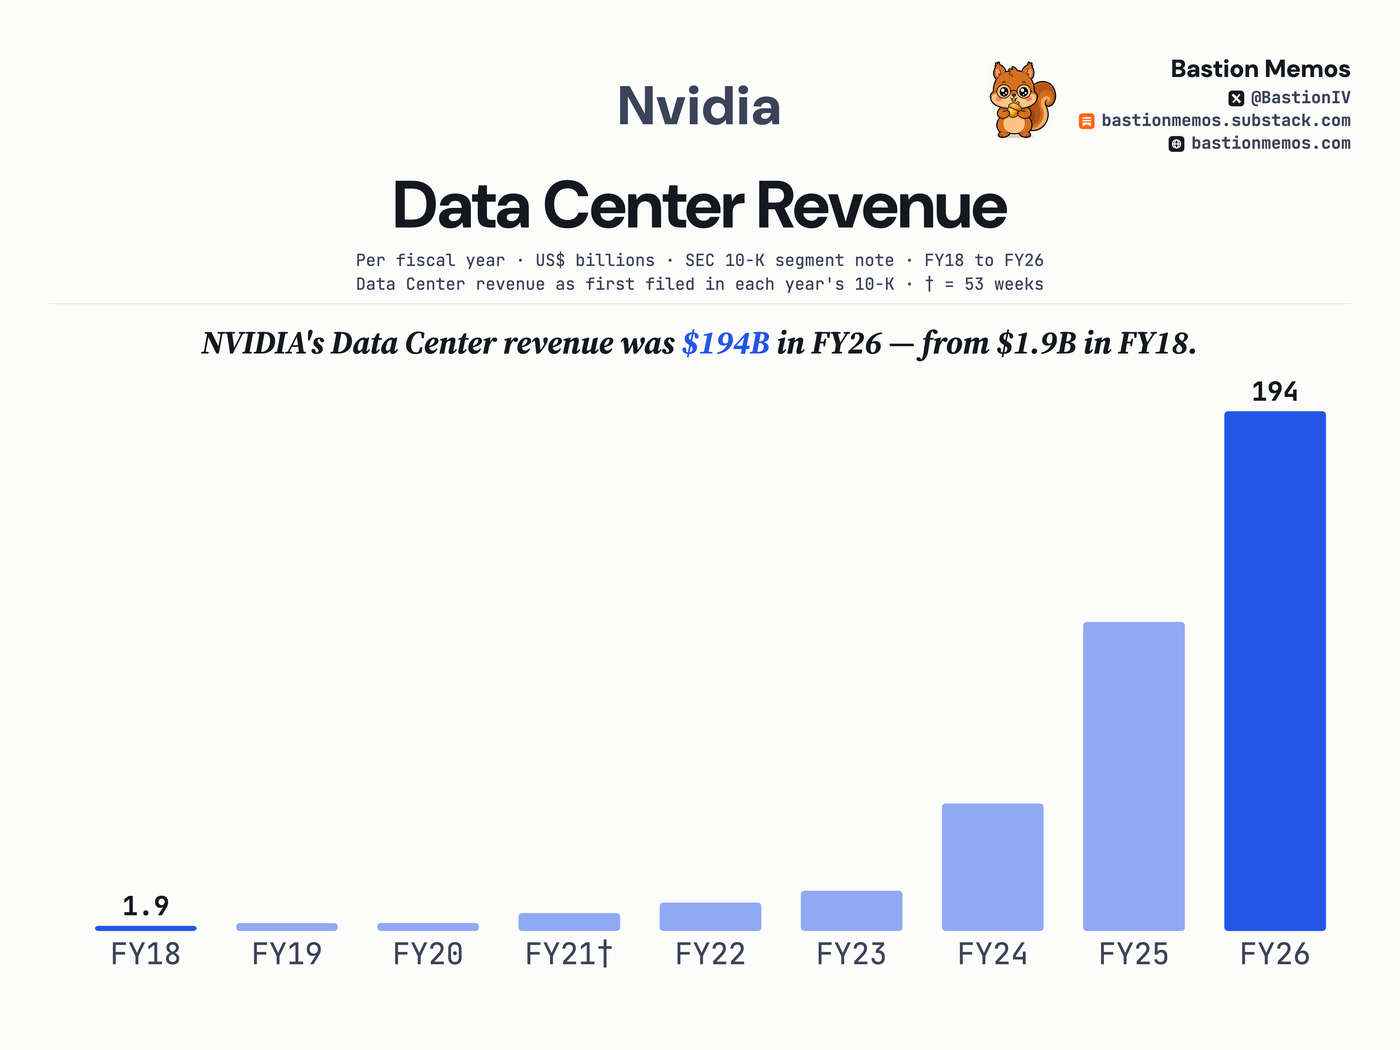
NVIDIA's Data Center revenue was $194B in FY26 — from $1.9B in FY18.
Nine years of one segment row, as each year's own filing stated it. The AI buildout is this line; the rest of the company now moves around it.
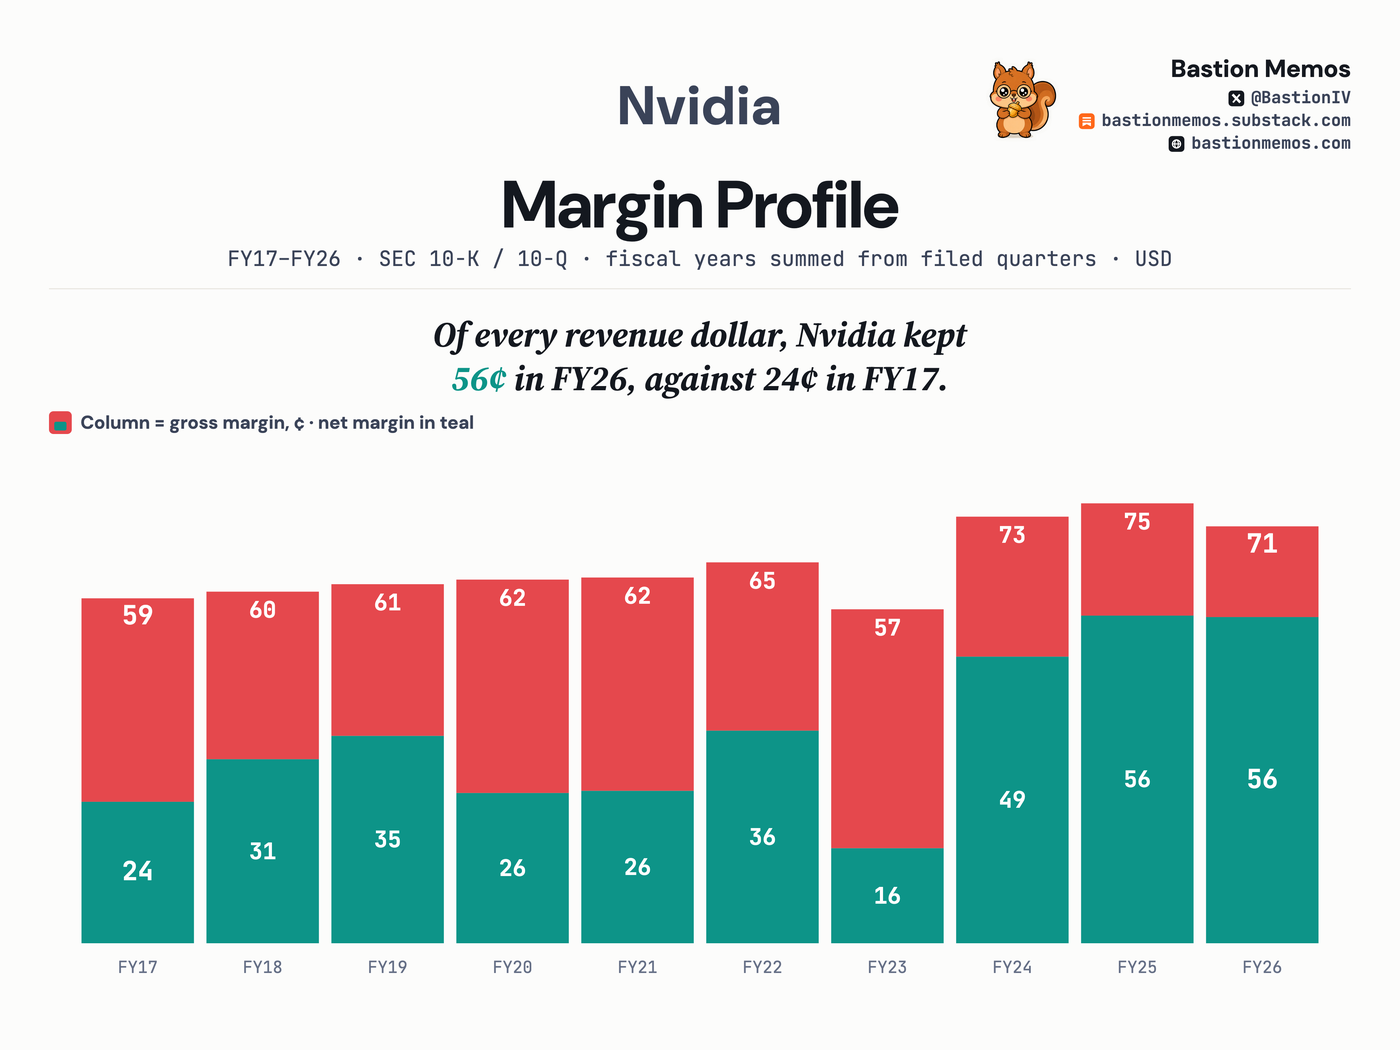
Of every revenue dollar, Nvidia kept 56¢ in FY26, against 24¢ in FY17.
Margins drawn from the filed statements, year by year. The step change arrives with the data-center mix and stays.
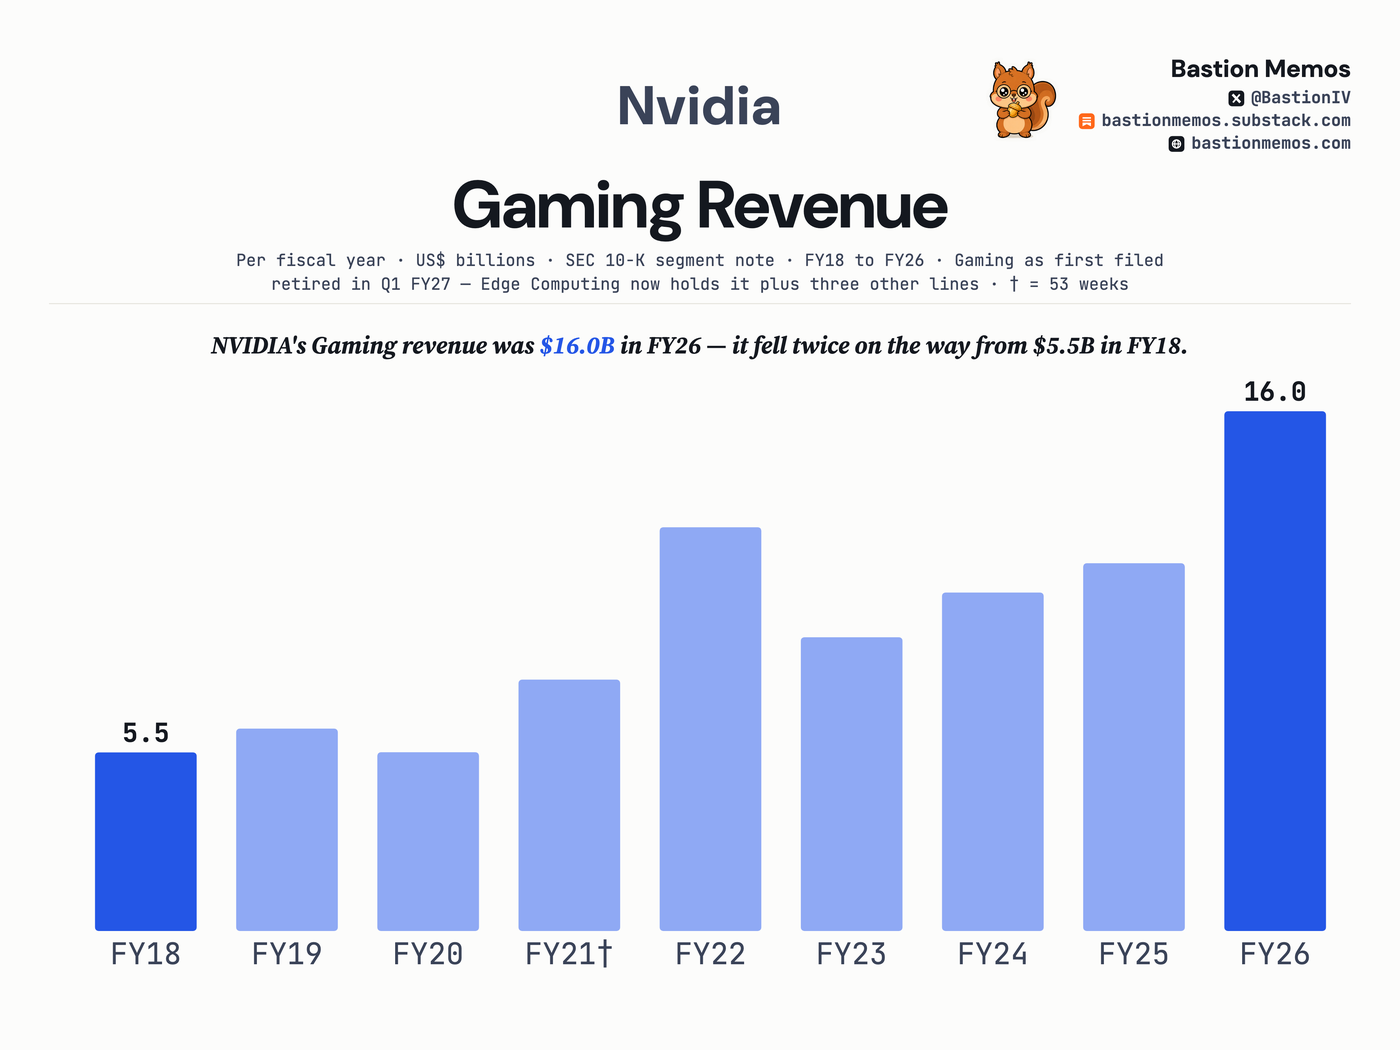
NVIDIA's Gaming revenue was $16.0B in FY26 — it fell twice on the way from $5.5B in FY18.
The business NVIDIA was known for, on its own row. It fell twice on the way while the company total kept climbing.
Where the revenue came from
| Segment | Amount | % of revenue | Y/Y |
|---|---|---|---|
| Hyperscale | $48.7B | 50.6% | +102% |
| AI Clouds Industrial Enterprise | $40.3B | 41.9% | +138% |
| Edge Computing | $7.2B | 7.5% | +27% |
Income statement, line by line
| Line | Amount | % of revenue | Y/Y |
|---|---|---|---|
| Revenue | $96.2B | +106% | |
| Cost of revenue | $24.1B | 25.0% | +87% |
| Gross profit | $72.1B | 75.0% | +113% |
| Operating expenses | $8.4B | 8.7% | +55% |
| Operating income | $63.7B | 66.2% | +124% |
| Pretax income | $71.5B | 74.3% | +129% |
| Income tax | $11.8B | 12.3% | +147% |
| Net income | $59.7B | 62.0% | +126% |
— means the filing states no comparable prior-year figure for that line, so we do not compute one.
Effective tax rate: 16.5%. That is tax as a share of pretax income. The 12.3% in the column above is tax as a share of revenue, which is not a tax rate.
The last 8 quarters
| Quarter ended | Revenue | Net income | Net margin |
|---|---|---|---|
| Jul 26, 2026 | $96.2B | $59.7B | 62.0% |
| Apr 26, 2026 | $81.6B | $58.3B | 71.5% |
| Jan 25, 2026 | $68.1B | $43.0B | 63.1% |
| Oct 26, 2025 | $57.0B | $31.9B | 56.0% |
| Jul 27, 2025 | $46.7B | $26.4B | 56.5% |
| Apr 27, 2025 | $44.1B | $18.8B | 42.6% |
| Jan 26, 2025 | $39.3B | $22.1B | 56.2% |
| Oct 27, 2024 | $35.1B | $19.3B | 55.0% |
Held by tracked 13F managers
NVIDIA CORP COM: 19 of 69 tracked managers reported holding it — $34,948M across tracked reports, as filed.
13F reports arrive up to 45 days after quarter end and may be amended; totals sum across tracked reports, not unique economic ownership.
Get the next Nvidia card when it files — free, one issue a week, no ratings. Subscribe on Substack.