Philip Morris (PM) Q2 FY26 earnings
Revenue $11.2B, up 10% from a year ago. Net income $2.8B.
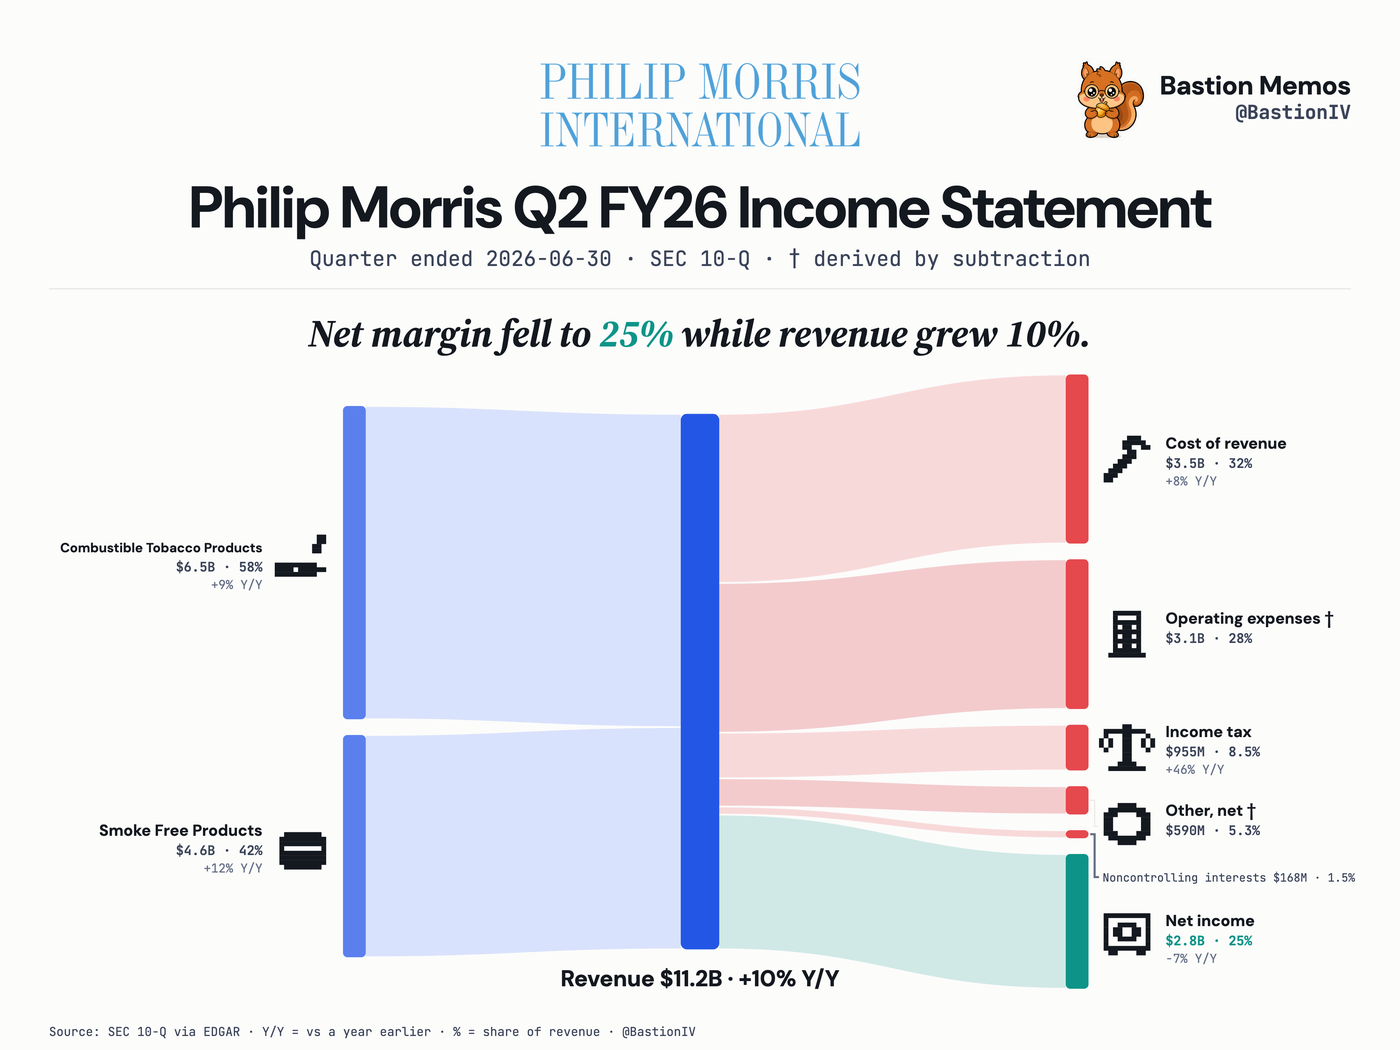
Philip Morris grew revenue 10% to $11.2B, with combustible tobacco still 58% of the quarter at $6.5B. Net income was $2.8B — a 25% margin, down 7% Y/Y after a 46% jump in income tax.
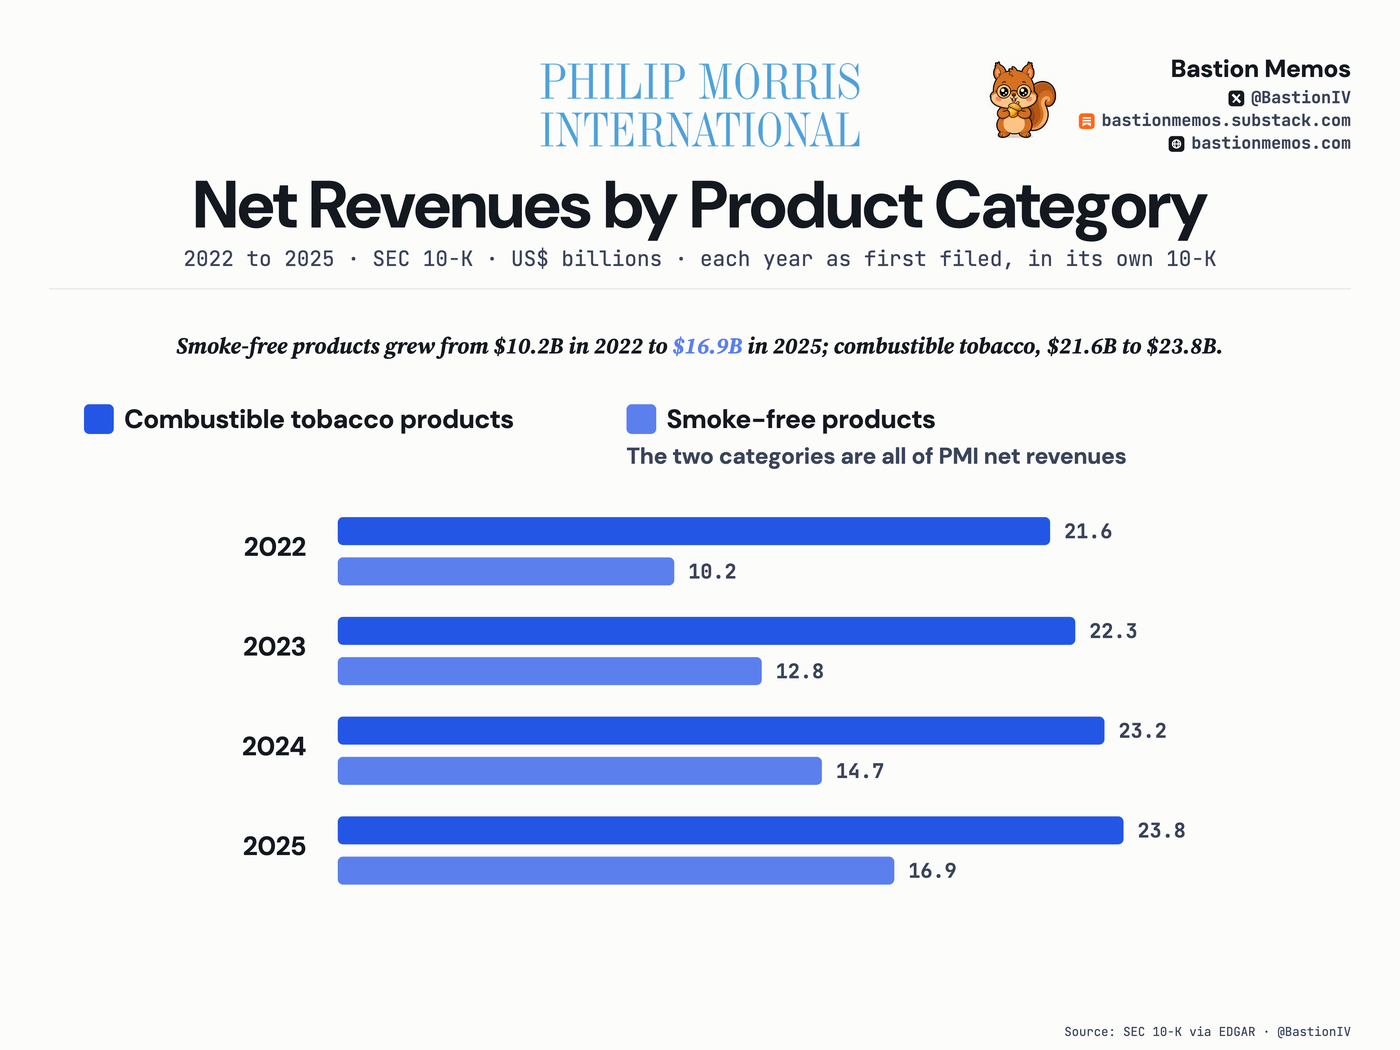
Smoke-free products grew from $10.2B in 2022 to $16.9B in 2025; combustible tobacco, $21.6B to $23.8B.
The transition in audited dollars: the two product categories are all of PMI's net revenues, and the smoke-free line has closed most of the gap in four years. From 2026 the filer's reporting segments are built on this axis.
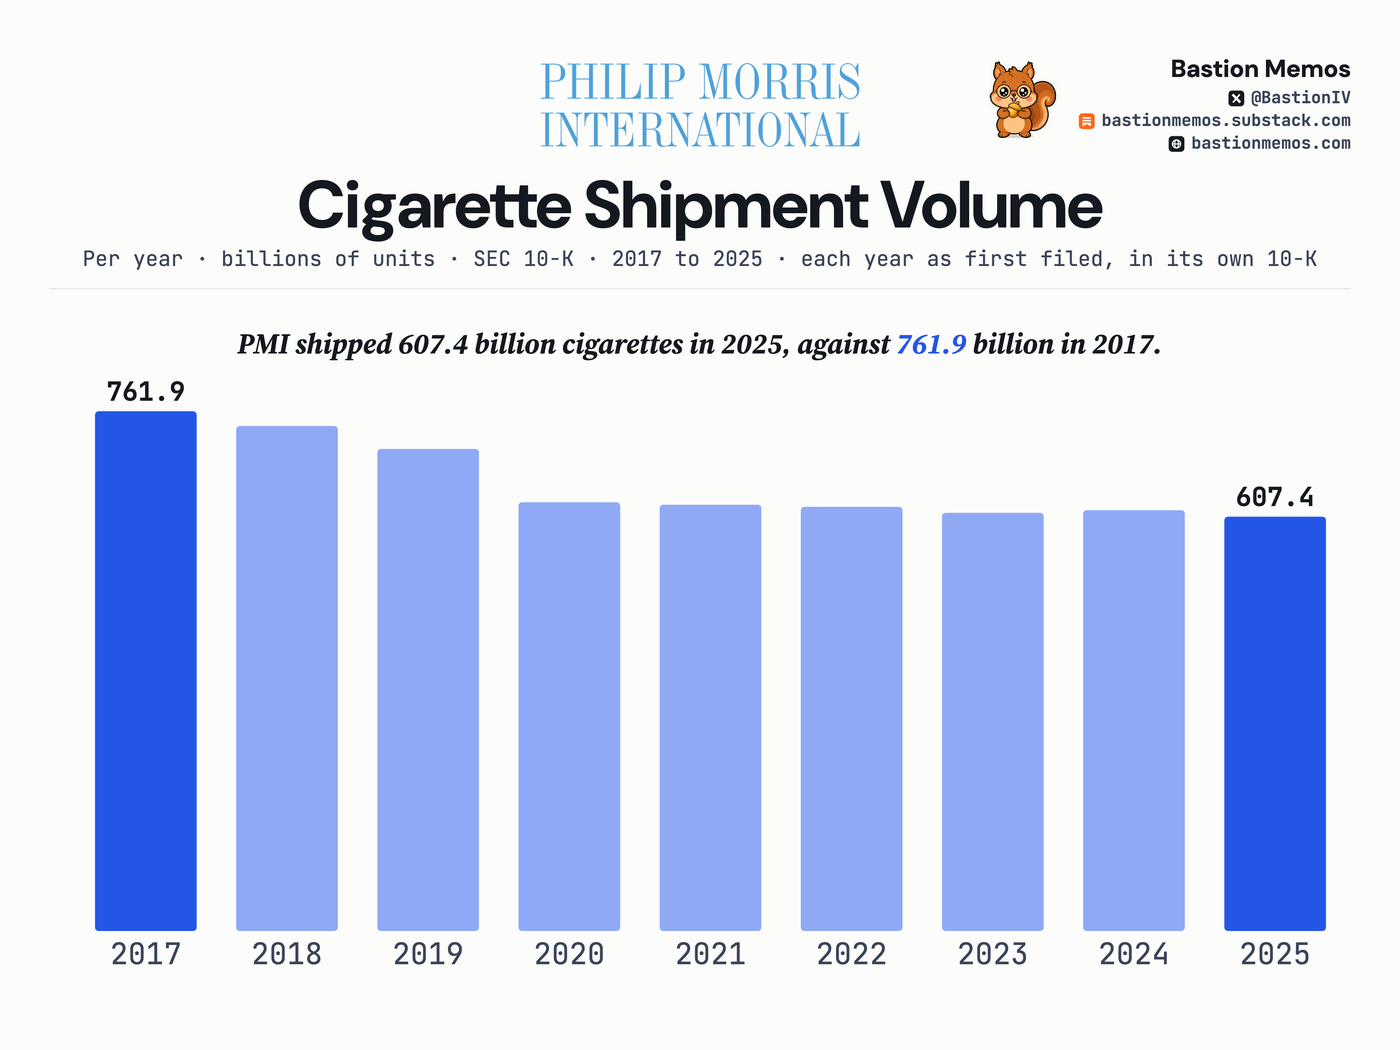
PMI shipped 607.4 billion cigarettes in 2025, against 761.9 billion in 2017.
Nine years of the unit decline behind the dollar shift — never restated in any filing. The filer's own combined line, Total Cigarettes and Heated Tobacco Units, fell from 798.2 to 762.5 billion across the same span; heated units grew inside it.
Where the revenue came from
| Segment | Amount | % of revenue | Y/Y |
|---|---|---|---|
| Combustible Tobacco Products | $6.5B | 58.5% | +9% |
| Smoke-Free Products | $4.6B | 41.5% | +12% |
Income statement, line by line
| Line | Amount | % of revenue | Y/Y |
|---|---|---|---|
| Revenue | $11.2B | +10% | |
| Cost of revenue | $3.5B | 31.6% | +8% |
| Gross profit | $7.7B | 68.4% | +12% |
| Operating expenses † | $3.1B | 28.0% | -1% |
| Operating income | $4.5B | 40.5% | +22% |
| Income tax | $955M | 8.5% | +46% |
| Net income | $2.8B | 25.2% | -7% |
— means the filing states no comparable prior-year figure for that line, so we do not compute one.
The filing also prints consolidated net income of $3.0B, of which $168M belongs to outside co-owners of Philip Morris's subsidiaries (noncontrolling interests, in the filing's words). The figures above are net income attributable to Philip Morris, the filer's own line.
Effective tax rate: 22.3%. That is tax as a share of pretax income. The 8.5% in the column above is tax as a share of revenue, which is not a tax rate.
† The filing doesn't print this line. We calculated it from the filed figures; it adds up to the dollar.
The last 8 quarters
| Quarter ended | Revenue | Net income | Net margin |
|---|---|---|---|
| Jun 30, 2026 | $11.2B | $2.8B | 25.2% |
| Mar 31, 2026 | $10.1B | $2.4B | 24.0% |
| Dec 31, 2025 | $10.4B | $2.1B | 20.7% |
| Sep 30, 2025 | $10.8B | $3.5B | 32.1% |
| Jun 30, 2025 | $10.1B | $3.0B | 30.0% |
| Mar 31, 2025 | $9.3B | $2.7B | 28.9% |
| Dec 31, 2024 | $9.7B | ($579M) | (6.0%) |
| Sep 30, 2024 | $9.9B | $3.1B | 31.1% |
Held by tracked 13F managers
PHILIP MORRIS INTL INC (COM): 16 of 69 tracked managers reported holding it — $3,296M across tracked reports, as filed.
13F reports arrive up to 45 days after quarter end and may be amended; totals sum across tracked reports, not unique economic ownership.
Get the next Philip Morris card when it files — free, one issue a week, no ratings. Subscribe on Substack.