Charles Schwab (SCHW) Q2 FY26 earnings
Revenue $7.1B, up 21% from a year ago. Net income $2.8B.
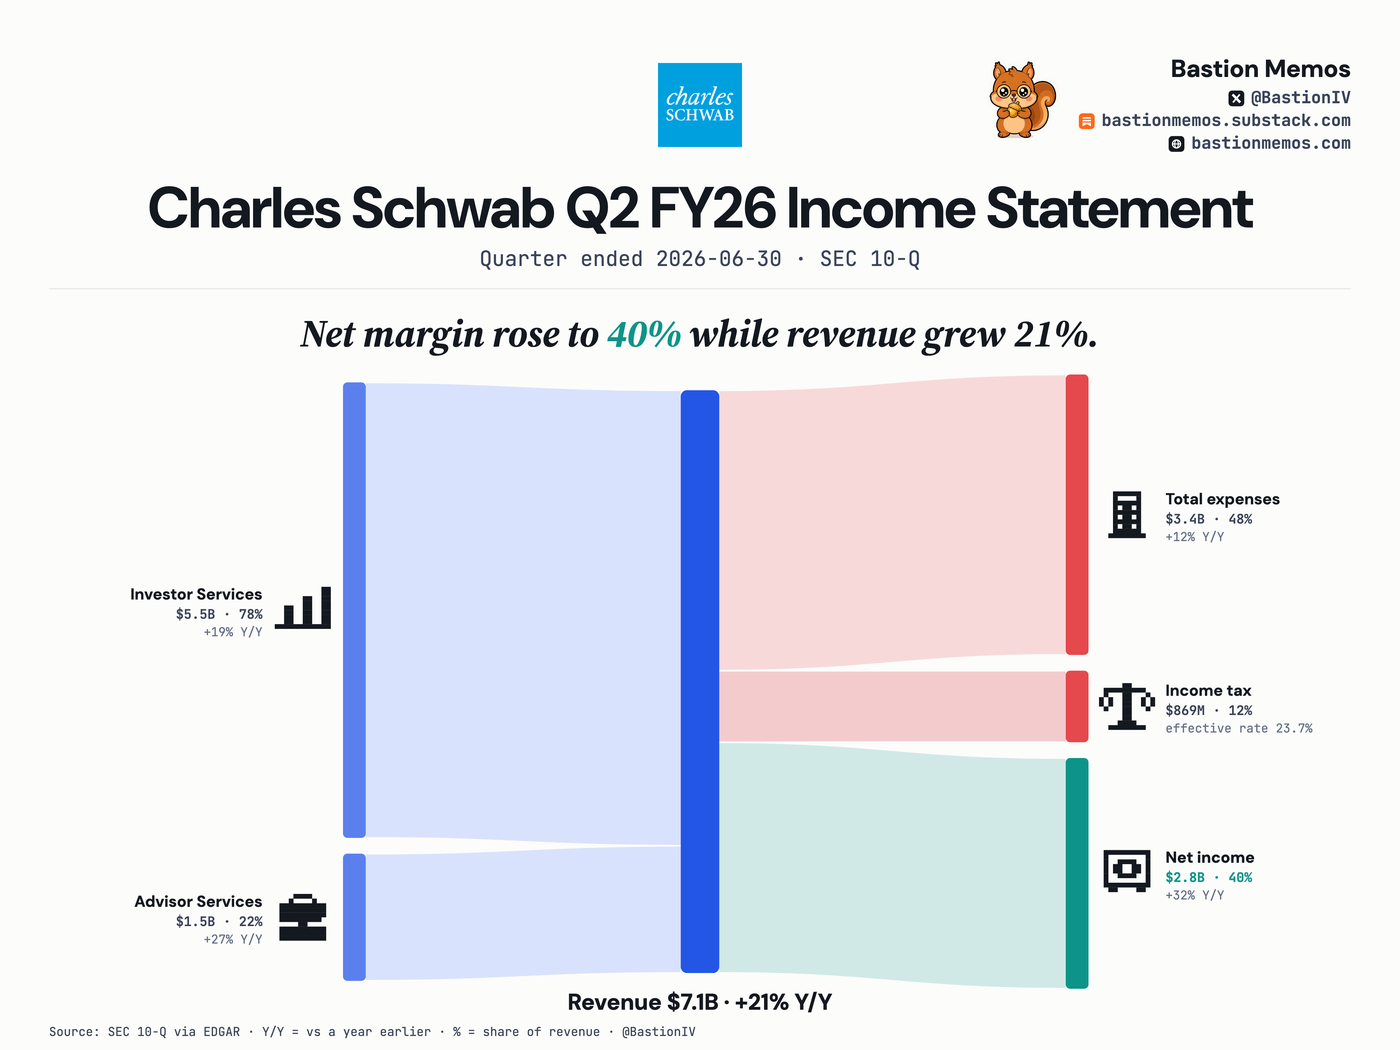
Charles Schwab grew revenue 21% to $7.1B, with Investor Services at $5.5B — 78% of the total. Net income was $2.8B, a 40% net margin, after a 23.7% effective tax rate.
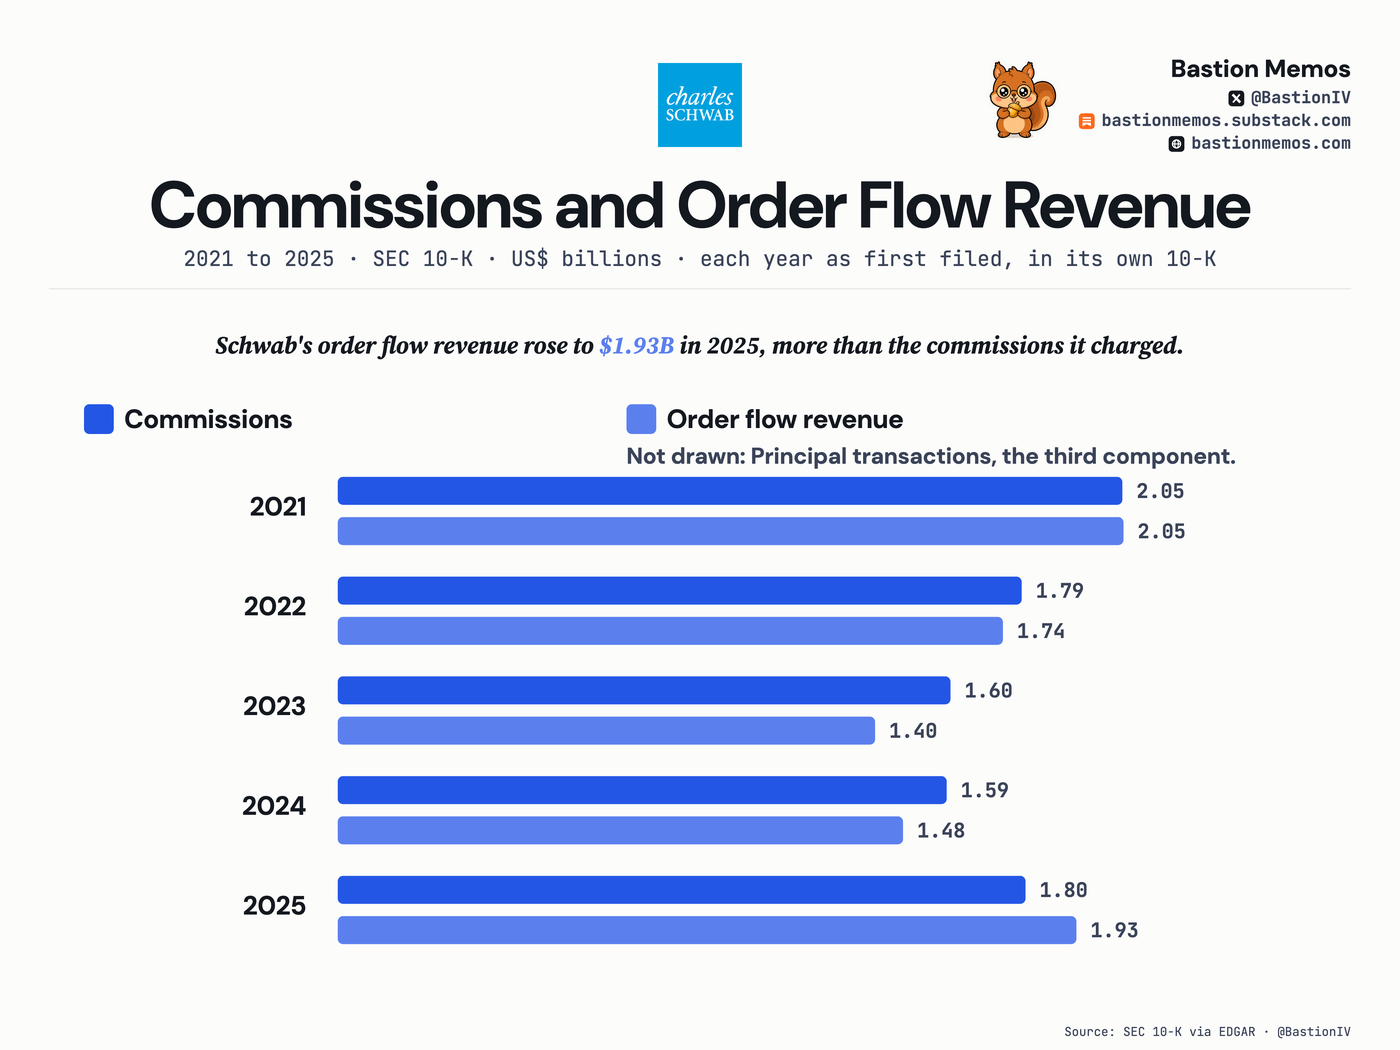
Schwab's order flow revenue rose to $1.93B in 2025, more than the commissions it charged.
Online U.S. stock trades have been commission-free since late 2019, yet Schwab still books commissions on other business — and in 2025 the venues' payments for order flow passed them. Both rows close into filed trading revenue to the dollar.
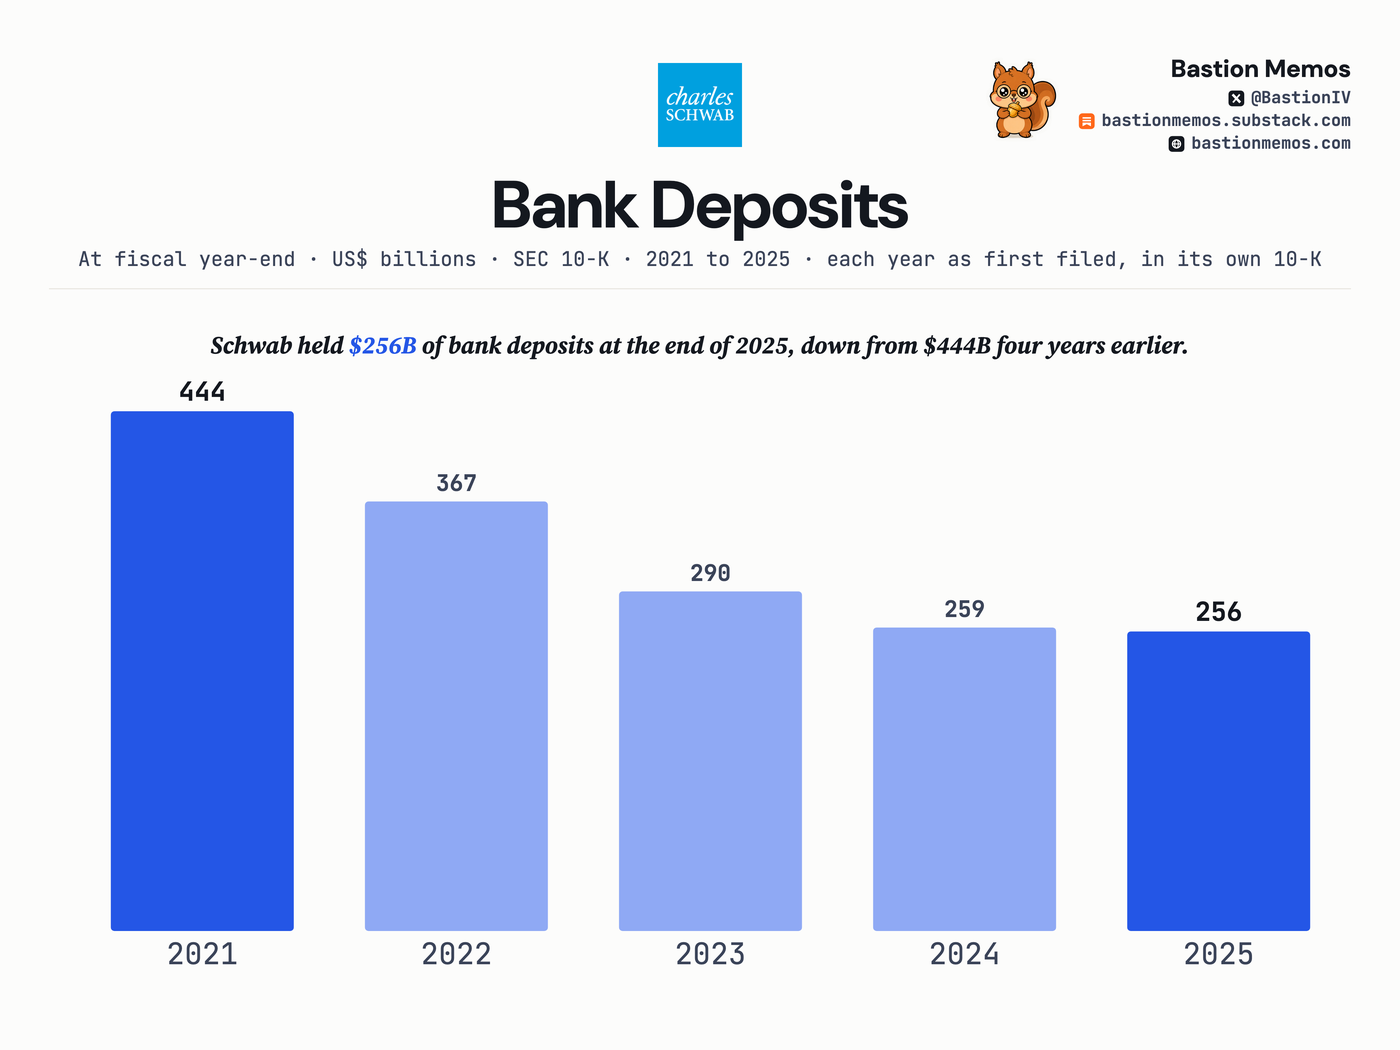
Schwab held $256B of bank deposits at the end of 2025, down from $444B four years earlier.
Year-end balance-sheet deposits, down every year since 2021 as client cash moved toward higher-yielding options. The balance includes brokered CDs Schwab issued — as much as $48.3B in 2023 — per the filer's deposit note.
Where the revenue came from
| Segment | Amount | % of revenue | Y/Y |
|---|---|---|---|
| Investor Services | $5.5B | 78.2% | +19% |
| Advisor Services | $1.5B | 21.8% | +27% |
Income statement, line by line
| Line | Amount | % of revenue | Y/Y |
|---|---|---|---|
| Revenue | $7.1B | +21% | |
| Pretax income | $3.7B | 51.9% | — |
| Income tax | $869M | 12.3% | +28% |
| Net income | $2.8B | 39.6% | +32% |
— means the filing states no comparable prior-year figure for that line, so we do not compute one.
The last 8 quarters
| Quarter ended | Revenue | Net income | Net margin |
|---|---|---|---|
| Jun 30, 2026 | $7.1B | $2.8B | 39.6% |
| Mar 31, 2026 | $6.5B | $2.5B | 38.2% |
| Dec 31, 2025 | $6.3B | $2.5B | 38.8% |
| Sep 30, 2025 | $6.1B | $2.4B | 38.4% |
| Jun 30, 2025 | $5.9B | $2.1B | 36.3% |
| Mar 31, 2025 | $5.6B | $1.9B | 34.1% |
| Dec 31, 2024 | $5.3B | $1.8B | 34.5% |
| Sep 30, 2024 | $4.8B | $1.4B | 29.0% |
Held by tracked 13F managers
The Charles Schwab Corp. (COM): 14 of 69 tracked managers reported holding it — $13,557M across tracked reports, as filed.
13F reports arrive up to 45 days after quarter end and may be amended; totals sum across tracked reports, not unique economic ownership.
Get the next Charles Schwab card when it files — free, one issue a week, no ratings. Subscribe on Substack.