Synopsys (SNPS) Q3 FY26 earnings
Revenue $2.5B, up 42% from a year ago. Net income $546M.
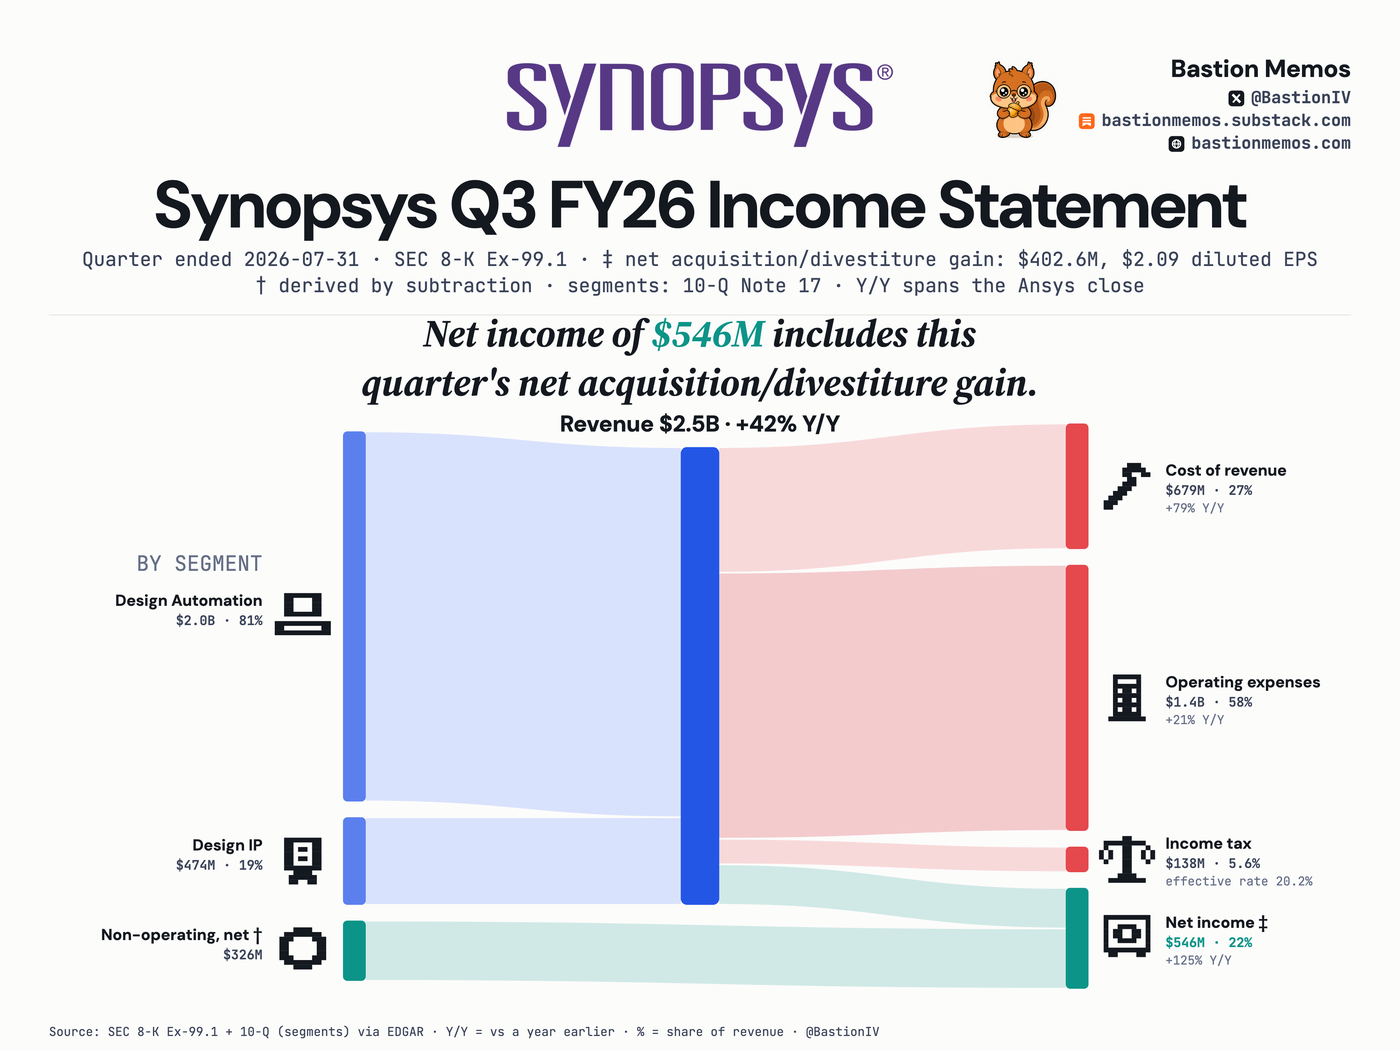
Synopsys grew revenue 42% to $2.5B in a quarter whose year-over-year spans the Ansys close. Net income of $546M includes the quarter's net acquisition/divestiture gain; Design Automation carried 81% of revenue.
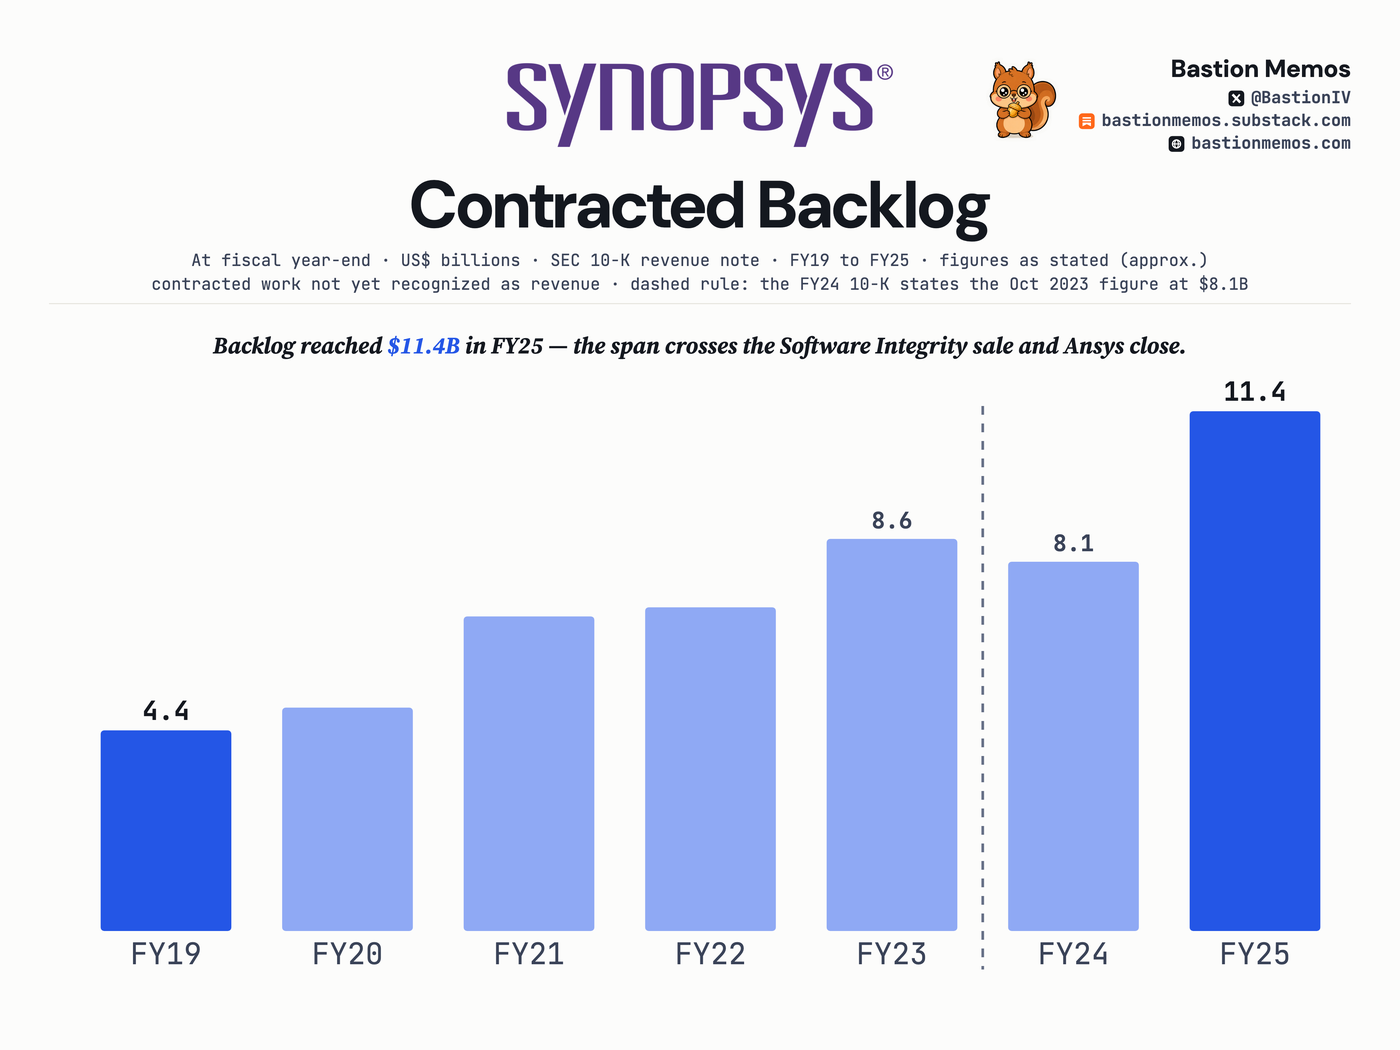
Contracted backlog at each fiscal year-end.
The filer's own backlog figure at each fiscal year-end.
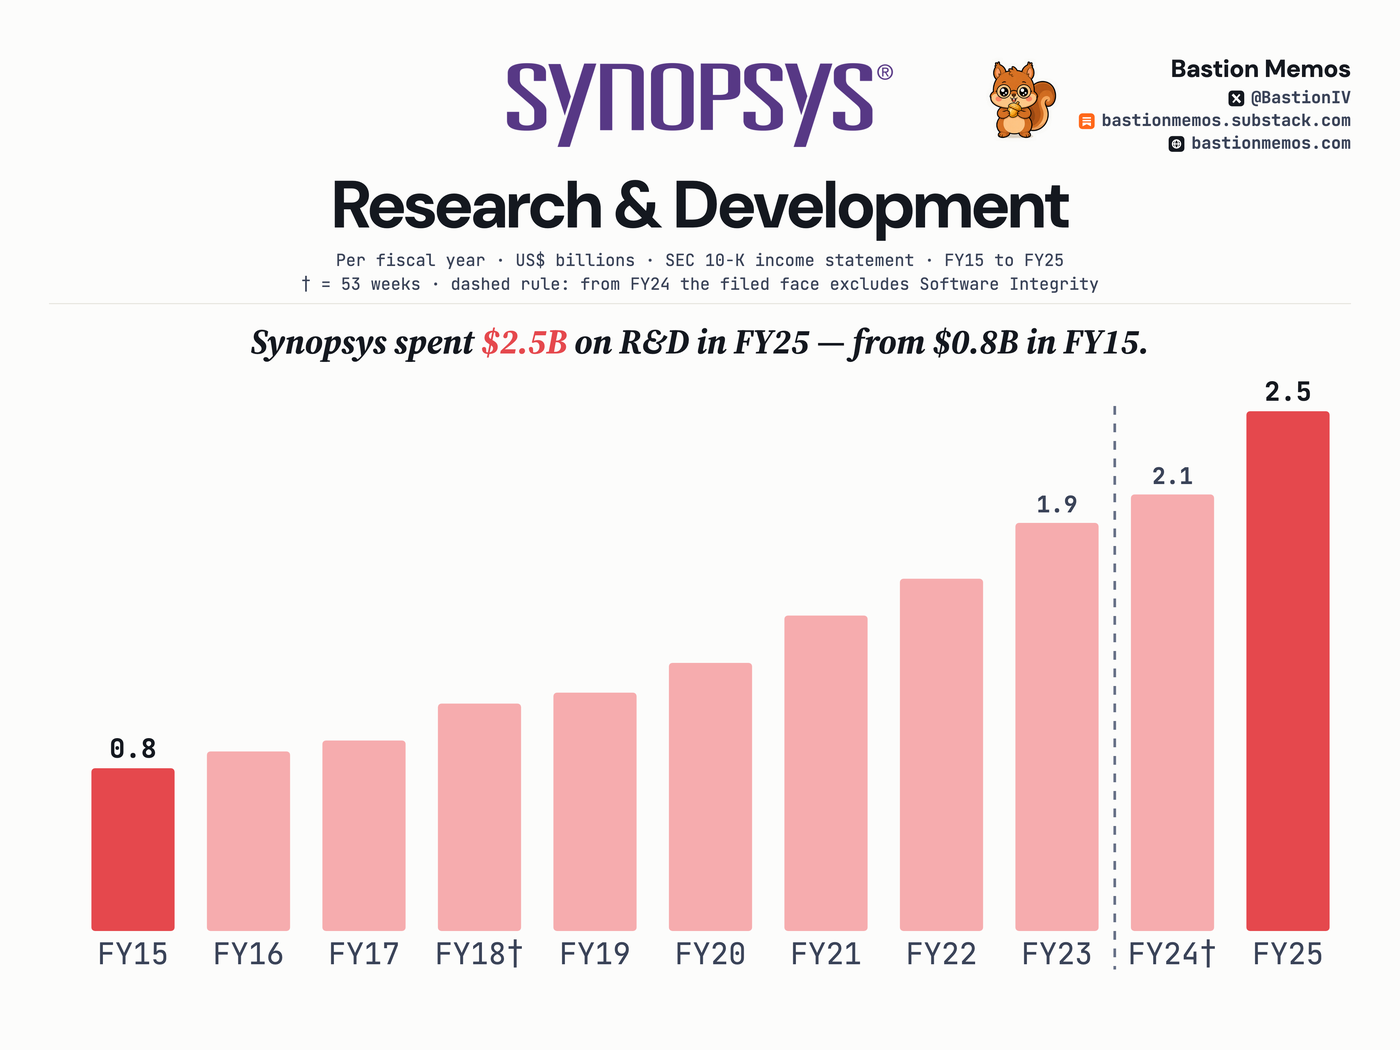
R&D spend as first filed, FY15 to FY25.
Research and development expense as first filed in each year's 10-K; the dashed rule marks the Software Integrity recast.
Where the revenue came from
| Segment | Amount | % of revenue | Y/Y |
|---|---|---|---|
| Design Automation | $2.0B | 80.9% | — |
| Design IP | $474M | 19.1% | — |
Income statement, line by line
| Line | Amount | % of revenue | Y/Y |
|---|---|---|---|
| Revenue | $2.5B | +42% | |
| Cost of revenue | $679M | 27.4% | +79% |
| Gross profit | $1.8B | 72.6% | +32% |
| Operating expenses | $1.4B | 58.1% | +21% |
| Operating income | $357M | 14.4% | +116% |
| Pretax income | $684M | 27.6% | +261% |
| Income tax | $138M | 5.6% | — |
| Net income | $546M | 22.0% | +125% |
— means the filing states no comparable prior-year figure for that line, so we do not compute one.
Effective tax rate: 20.2%. That is tax as a share of pretax income. The 5.6% in the column above is tax as a share of revenue, which is not a tax rate.
The last 8 quarters
| Quarter ended | Revenue | Net income | Net margin |
|---|---|---|---|
| Jul 31, 2026 | $2.5B | $546M | 22.0% |
| Apr 30, 2026 | $2.3B | $17M | 0.8% |
| Jan 31, 2026 | $2.4B | $65M | 2.7% |
| Oct 31, 2025 | $2.3B | $449M | 19.9% |
| Jul 31, 2025 | $1.7B | $243M | 13.9% |
| Apr 30, 2025 | $1.6B | $345M | 21.5% |
| Jan 31, 2025 | $1.5B | $296M | 20.3% |
| Oct 31, 2024 | $1.6B | $1.1B | 68.1% |
Held by tracked 13F managers
SYNOPSYS INC (COM): 10 of 69 tracked managers reported holding it — $730M across tracked reports, as filed.
13F reports arrive up to 45 days after quarter end and may be amended; totals sum across tracked reports, not unique economic ownership.
Get the next Synopsys card when it files — free, one issue a week, no ratings. Subscribe on Substack.