UnitedHealth (UNH) Q2 FY26 earnings
Revenue $112.0B, up 0% from a year ago. Net income $5.5B.
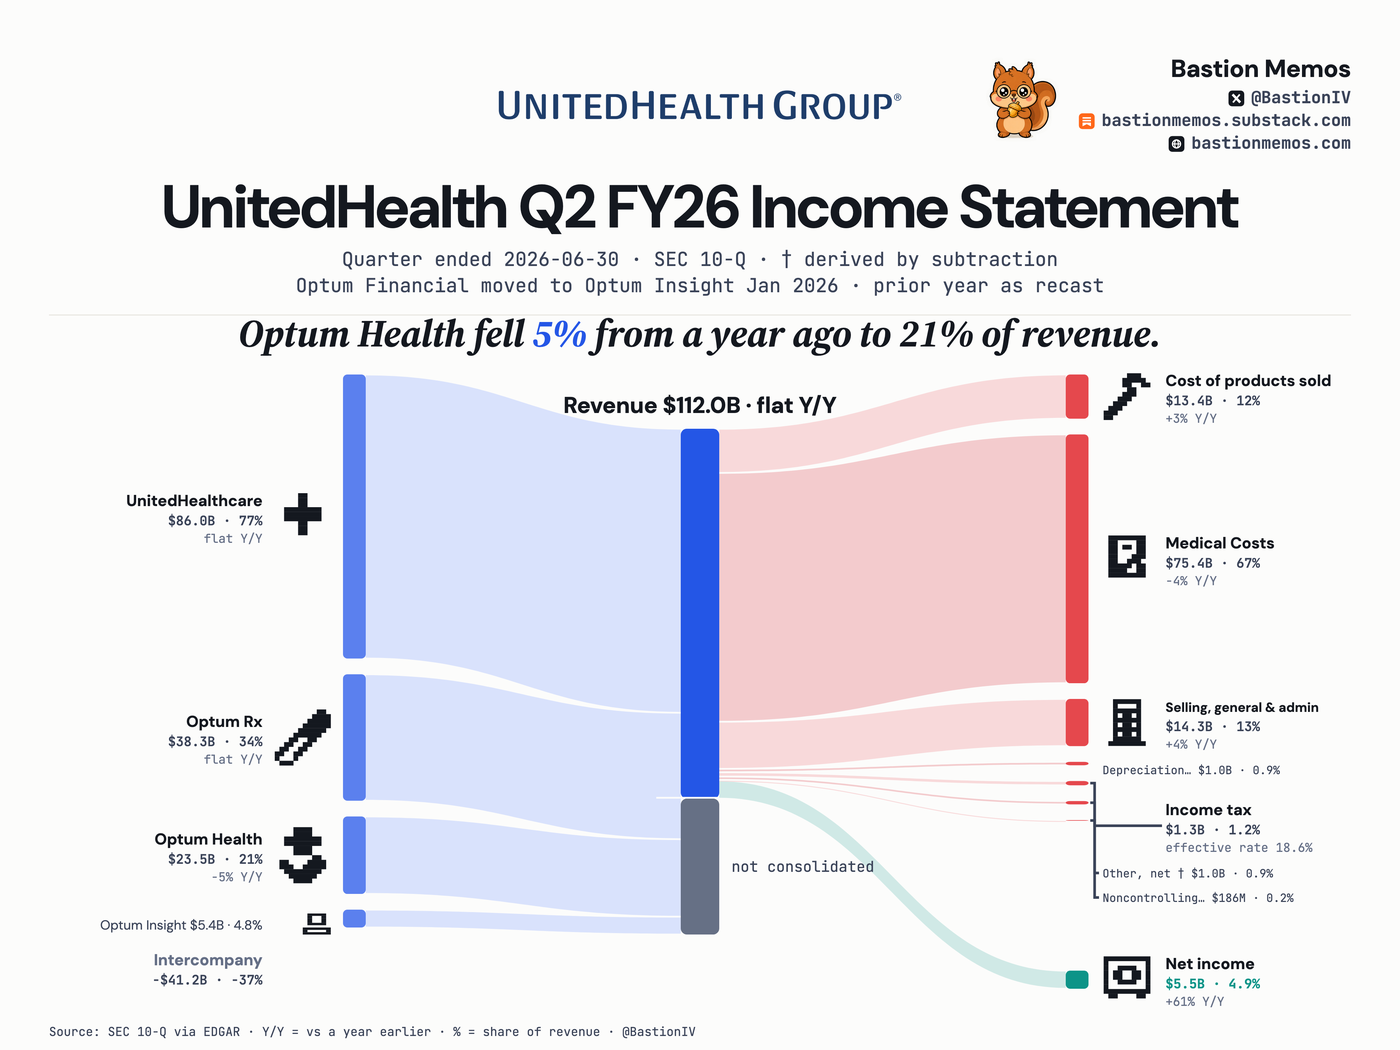
UnitedHealth's Q2 FY26 revenue was $112.0B, flat against a year ago, with UnitedHealthcare at $86.0B — 77% of the total — and $41.2B of intercompany revenue eliminated in consolidation. Net income was $5.5B, a 4.9% margin, up 61% Y/Y.
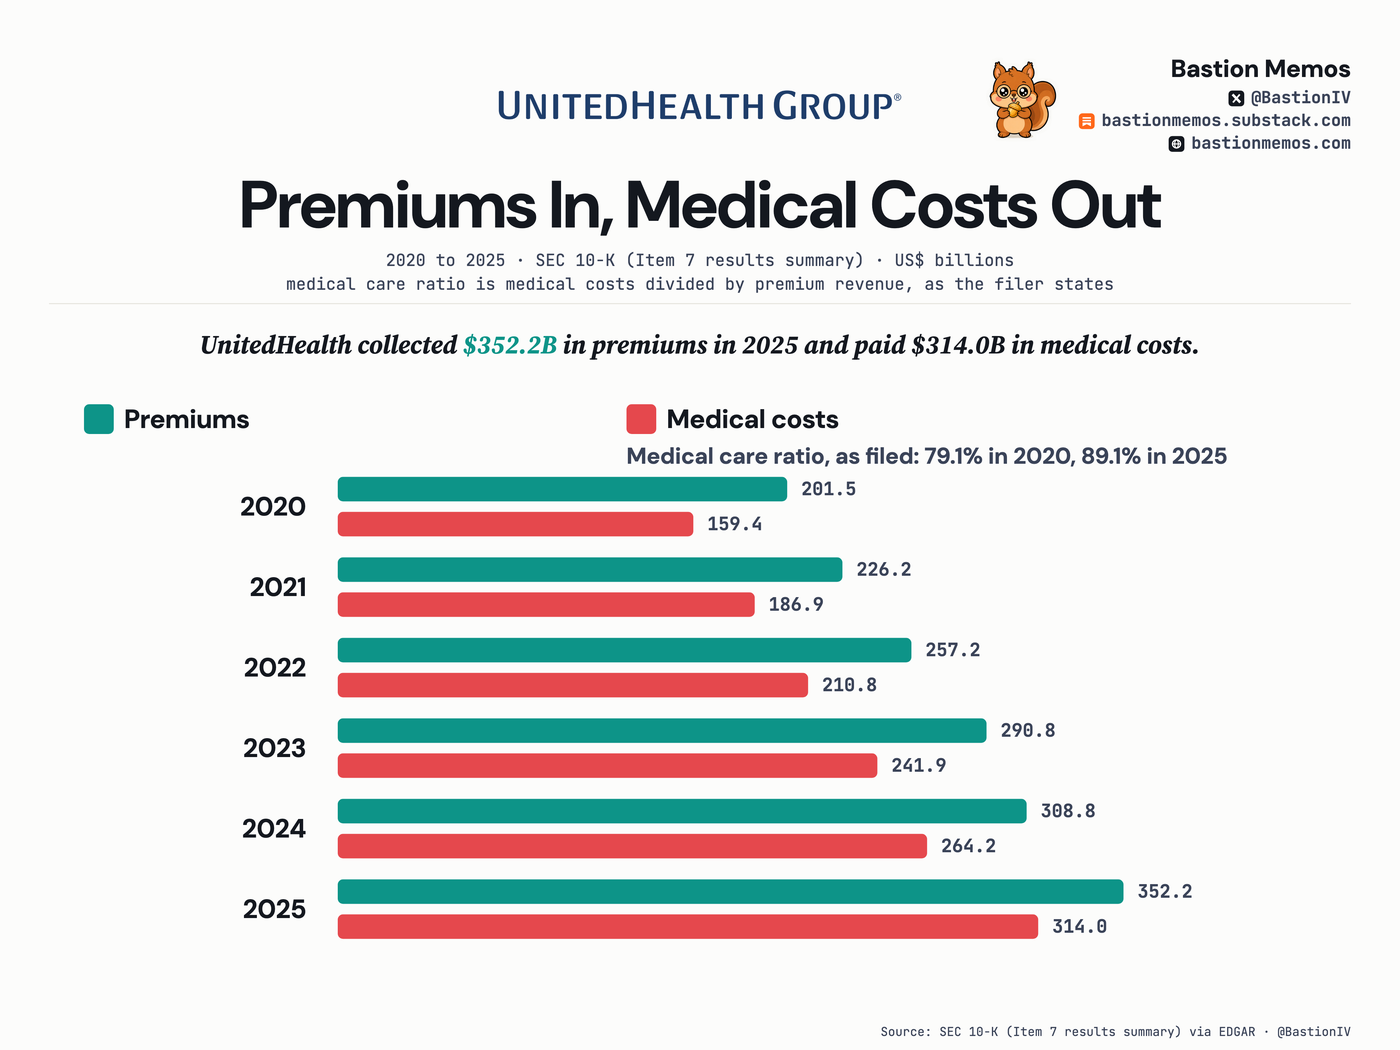
UnitedHealth collected $352.2B in premiums in 2025 and paid $314.0B in medical costs.
Six years of the two lines behind the medical care ratio: premiums earned against medical costs. The filer's own printed ratio moves from 79.1% in 2020 to 89.1% in 2025, and dividing the two drawn bars reproduces it in every year.
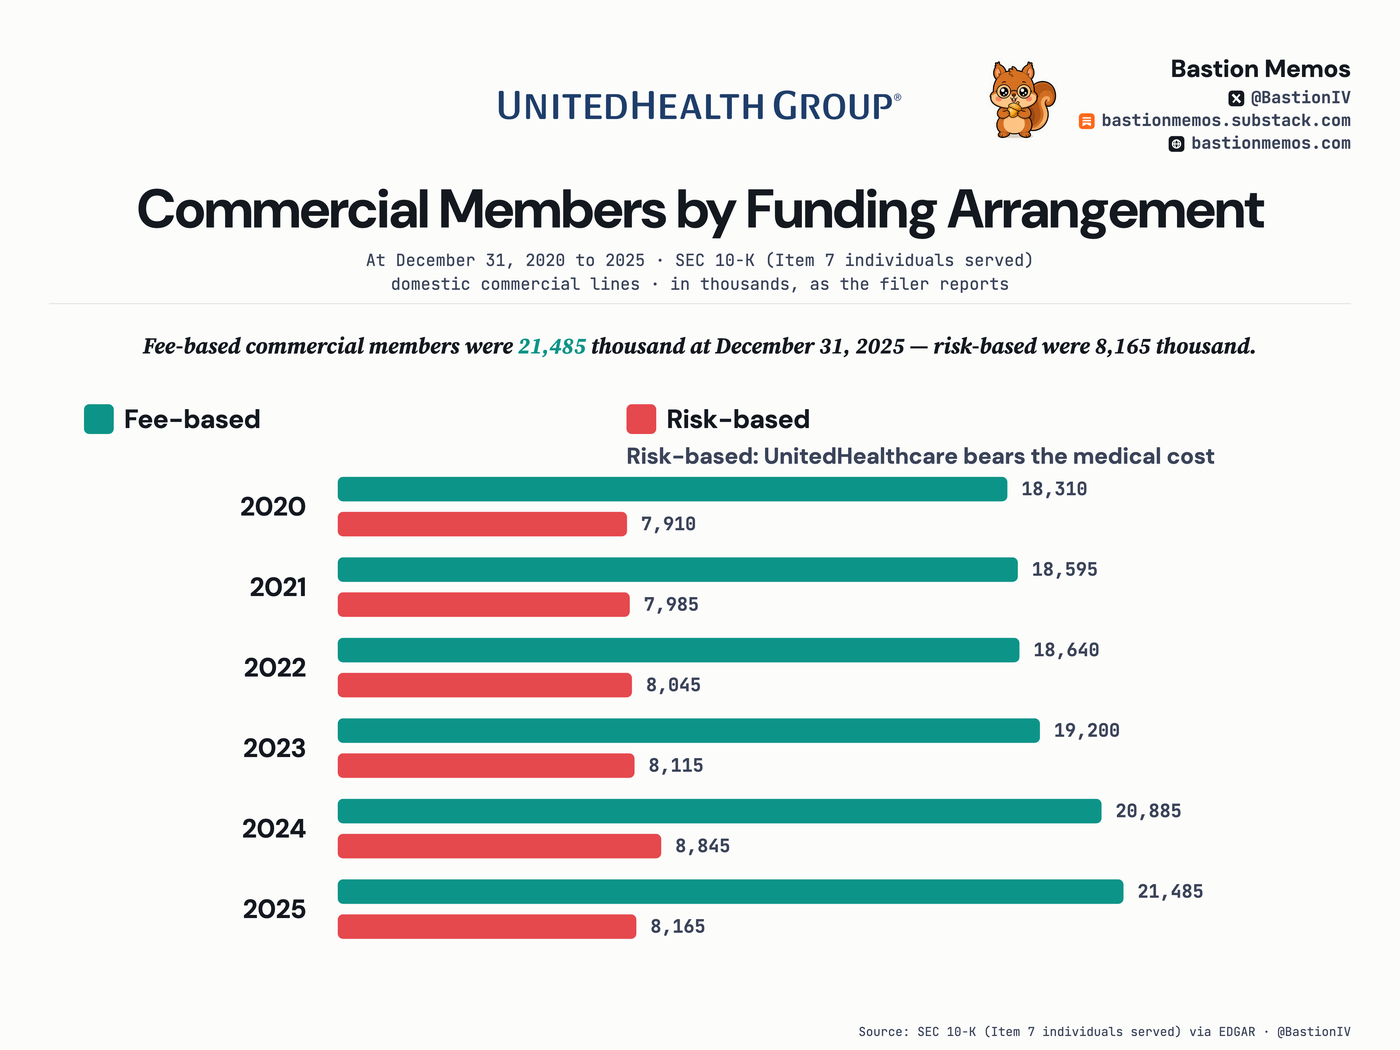
Fee-based commercial members were 21,485 thousand at December 31, 2025 — risk-based were 8,165 thousand.
The commercial book split the filer's own way: fee-based members, whose employers self-fund the medical risk, against risk-based members insured by UnitedHealthcare. Counts are the filer's, in thousands, for the domestic commercial lines.
Where the revenue came from
| Segment | Amount | % of revenue | Y/Y |
|---|---|---|---|
| UnitedHealthcare | $86.0B | 56.2% | -0% |
| Optum Rx | $38.3B | 25.0% | -0% |
| Optum Health | $23.5B | 15.3% | -5% |
| Optum Insight | $5.4B | 3.5% | +3% |
Income statement, line by line
| Line | Amount | % of revenue | Y/Y |
|---|---|---|---|
| Revenue | $112.0B | +0% | |
| Cost of revenue | $13.4B | 11.9% | +3% |
| Gross profit † | $98.7B | 88.1% | +0% |
| Operating expenses † | $90.7B | 80.9% | -3% |
| Operating income | $8.0B | 7.1% | +55% |
| Pretax income | $7.0B | 6.2% | — |
| Income tax | $1.3B | 1.2% | +155% |
| Net income | $5.5B | 4.9% | +61% |
— means the filing states no comparable prior-year figure for that line, so we do not compute one.
The filing also prints consolidated net income of $5.7B, of which $186M belongs to outside co-owners of UnitedHealth's subsidiaries (noncontrolling interests, in the filing's words). The figures above are net income attributable to UnitedHealth, the filer's own line.
† The filing doesn't print this line. We calculated it from the filed figures; it adds up to the dollar.
The last 8 quarters
| Quarter ended | Revenue | Net income | Net margin |
|---|---|---|---|
| Jun 30, 2026 | $112.0B | $5.5B | 4.9% |
| Mar 31, 2026 | $111.7B | $6.3B | 5.6% |
| Dec 31, 2025 | $113.2B | $10M | 0.0% |
| Sep 30, 2025 | $113.2B | $2.3B | 2.1% |
| Jun 30, 2025 | $111.6B | $3.4B | 3.1% |
| Mar 31, 2025 | $109.6B | $6.3B | 5.7% |
| Dec 31, 2024 | $100.8B | $5.5B | 5.5% |
| Sep 30, 2024 | $100.8B | $6.1B | 6.0% |
Held by tracked 13F managers
UNITEDHEALTH GROUP INC (COM): 18 of 69 tracked managers reported holding it — $12,180M across tracked reports, as filed.
13F reports arrive up to 45 days after quarter end and may be amended; totals sum across tracked reports, not unique economic ownership.
Get the next UnitedHealth card when it files — free, one issue a week, no ratings. Subscribe on Substack.