Visa (V) Q3 FY26 earnings
Revenue $11.6B, up 14% from a year ago. Net income $5.6B.
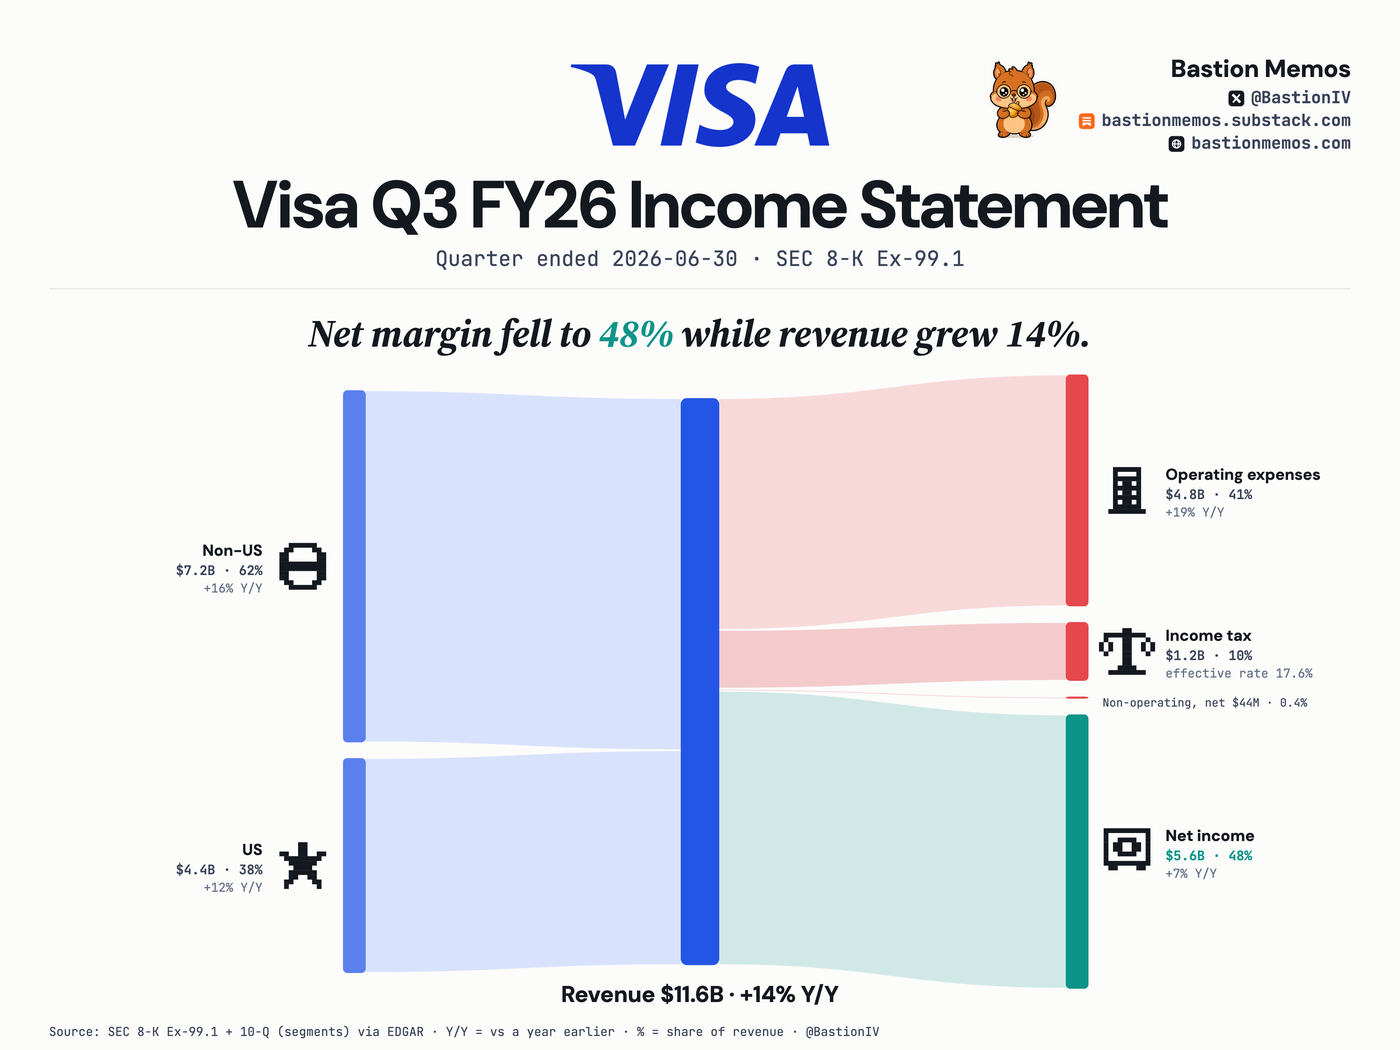
Visa's Q3 FY26 revenue was $11.6B, up 14% from a year ago, with $7.2B — 62% of it — earned outside the US. Net income was $5.6B, a 48% net margin, after a 17.6% effective tax rate. The figures come from the earnings release and the 10-Q.
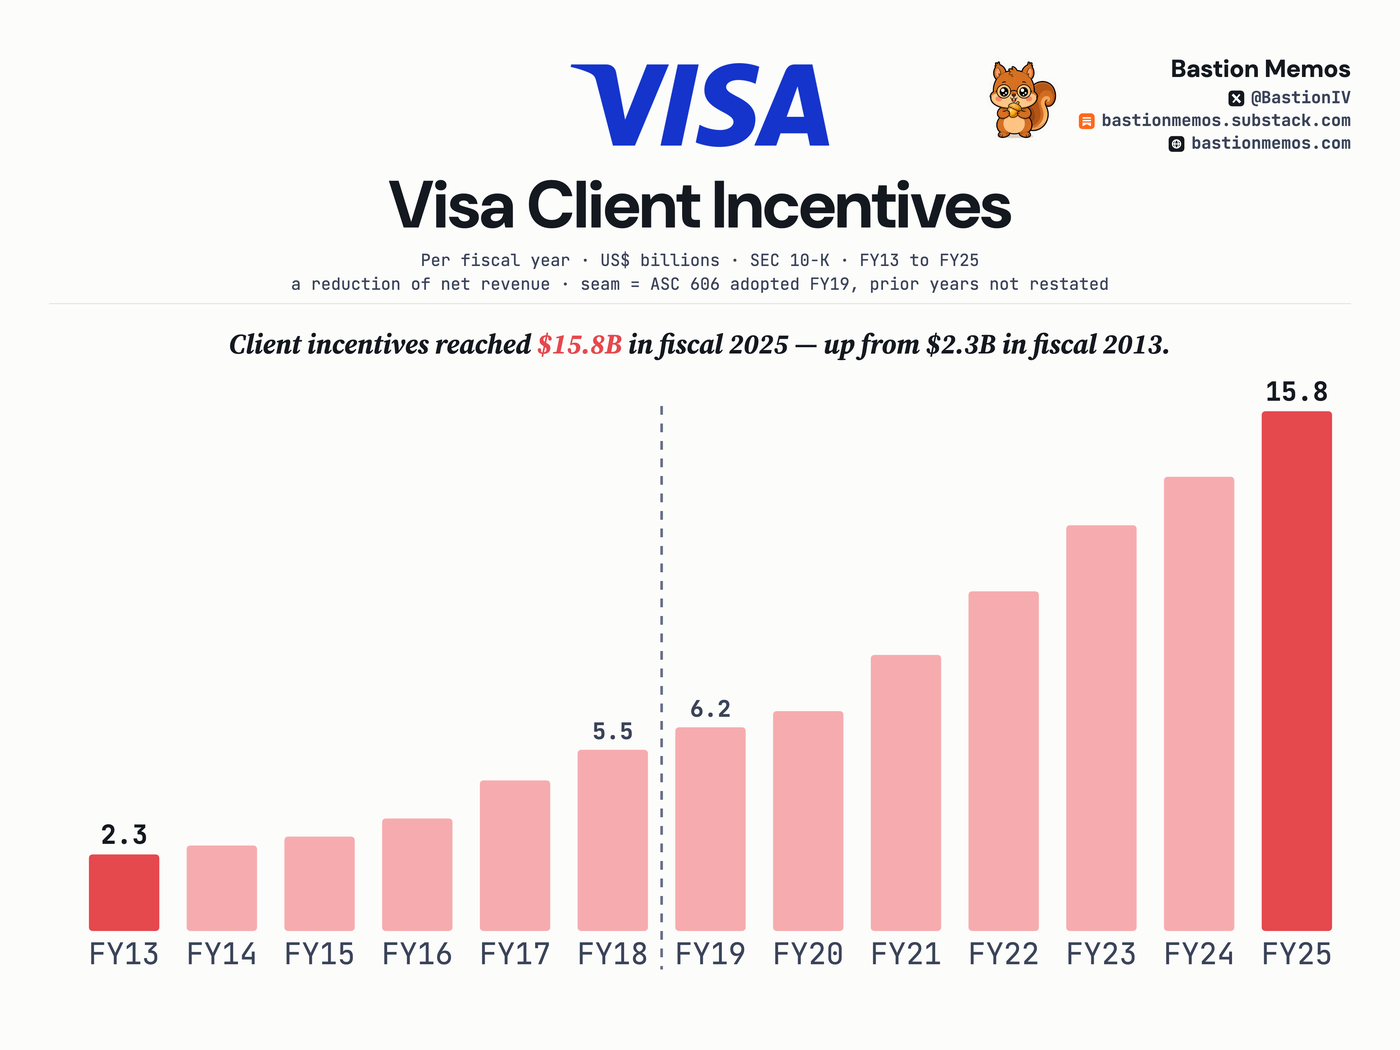
Client incentives reached $15.8B in fiscal 2025 — up from $2.3B in fiscal 2013.
The longer series behind the network: client incentives, the contractual amounts Visa recognizes as reductions to net revenue, rose in every one of the thirteen fiscal years drawn — $2.3B in FY13 to $15.8B in FY25. The dashed seam marks ASC 606 adoption in FY19; earlier years are as first filed.
Where the revenue came from
| Segment | Amount | % of revenue | Y/Y |
|---|---|---|---|
| Non-US | $7.2B | 62.1% | +16% |
| US | $4.4B | 37.9% | +12% |
Income statement, line by line
| Line | Amount | % of revenue | Y/Y |
|---|---|---|---|
| Revenue | $11.6B | +14% | |
| Operating expenses | $4.8B | 40.9% | +19% |
| Operating income | $6.9B | 59.1% | +11% |
| Pretax income | $6.8B | 58.7% | +8% |
| Income tax | $1.2B | 10.4% | +14% |
| Net income | $5.6B | 48.4% | +7% |
— means the filing states no comparable prior-year figure for that line, so we do not compute one.
Effective tax rate: 17.6%. That is tax as a share of pretax income. The 10.4% in the column above is tax as a share of revenue, which is not a tax rate.
The last 8 quarters
| Quarter ended | Revenue | Net income | Net margin |
|---|---|---|---|
| Jun 30, 2026 | $11.6B | $5.6B | 48.4% |
| Mar 31, 2026 | $11.2B | $6.0B | 53.6% |
| Dec 31, 2025 | $10.9B | $5.9B | 53.7% |
| Sep 30, 2025 | $10.7B | $5.1B | 47.5% |
| Jun 30, 2025 | $10.2B | $5.3B | 51.8% |
| Mar 31, 2025 | $9.6B | $4.6B | 47.7% |
| Dec 31, 2024 | $9.5B | $5.1B | 53.8% |
| Sep 30, 2024 | $9.6B | $5.3B | 55.3% |
Held by tracked 13F managers
VISA INC (COM CL A): 29 of 69 tracked managers reported holding it — $23,241M across tracked reports, as filed.
13F reports arrive up to 45 days after quarter end and may be amended; totals sum across tracked reports, not unique economic ownership.
Get the next Visa card when it files — free, one issue a week, no ratings. Subscribe on Substack.