Wells Fargo (WFC) Q2 FY26 earnings
Revenue $22.6B, up 9% from a year ago. Net income $6.4B.
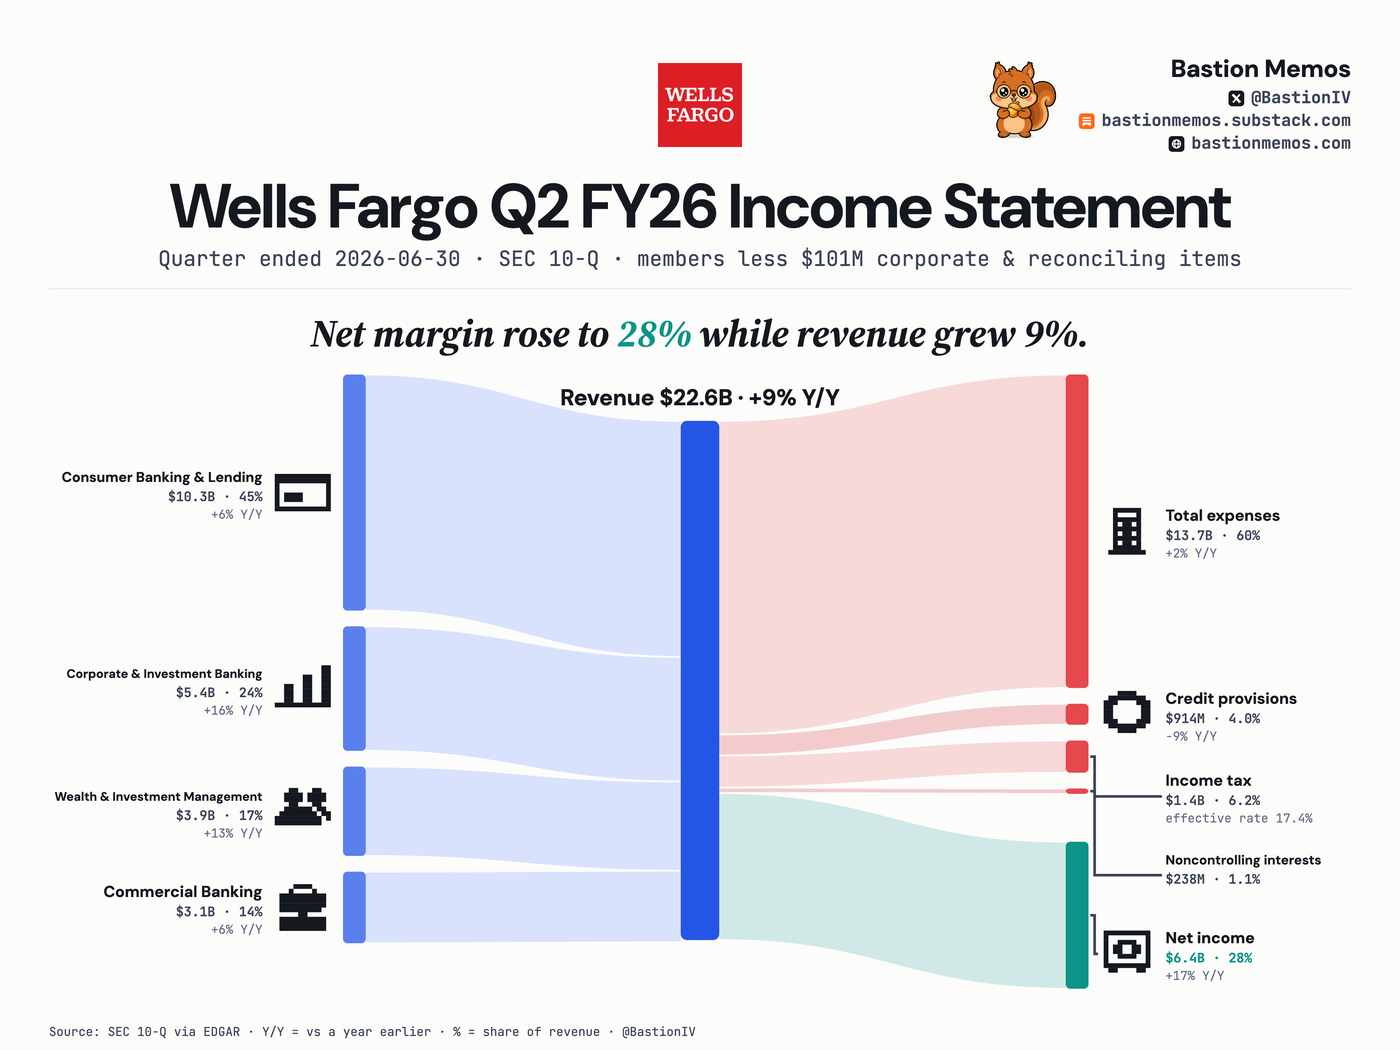
Wells Fargo's quarter had $22.6B of revenue, up 9% from a year ago, with Consumer Banking & Lending at 45% of it. Net income of $6.4B was 28% of revenue, up 17%.
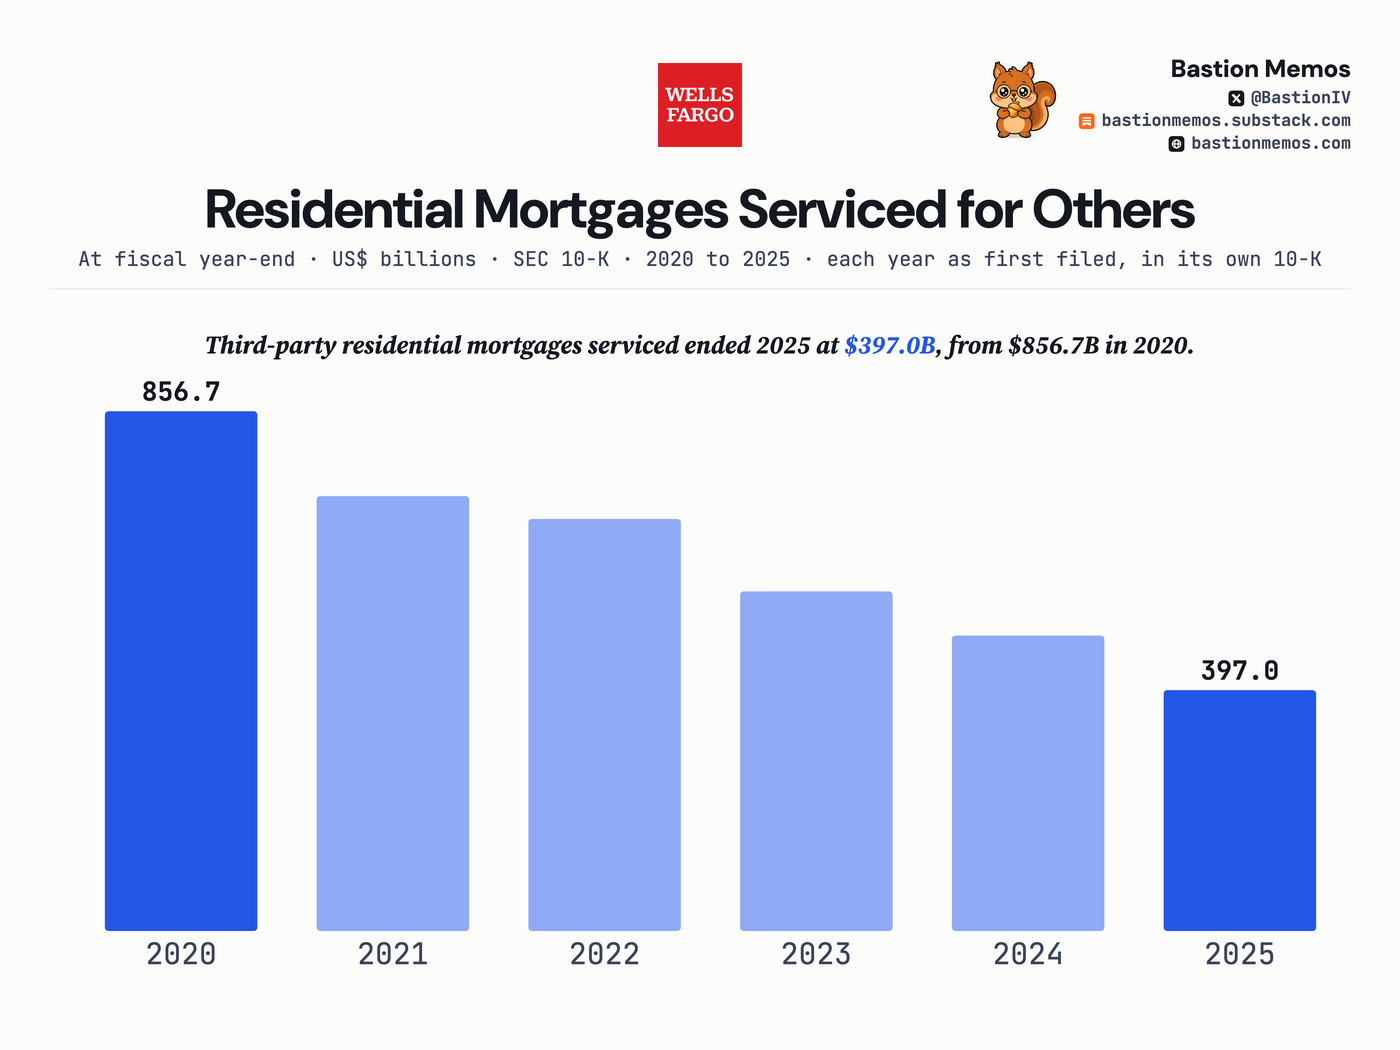
Third-party residential mortgages serviced ended 2025 at $397.0B, from $856.7B in 2020.
The filer's own Home Lending metric, drawn at fiscal year-end; loans Wells Fargo subservices for others sit outside it. Commercial servicing is a separate book and is not drawn here.
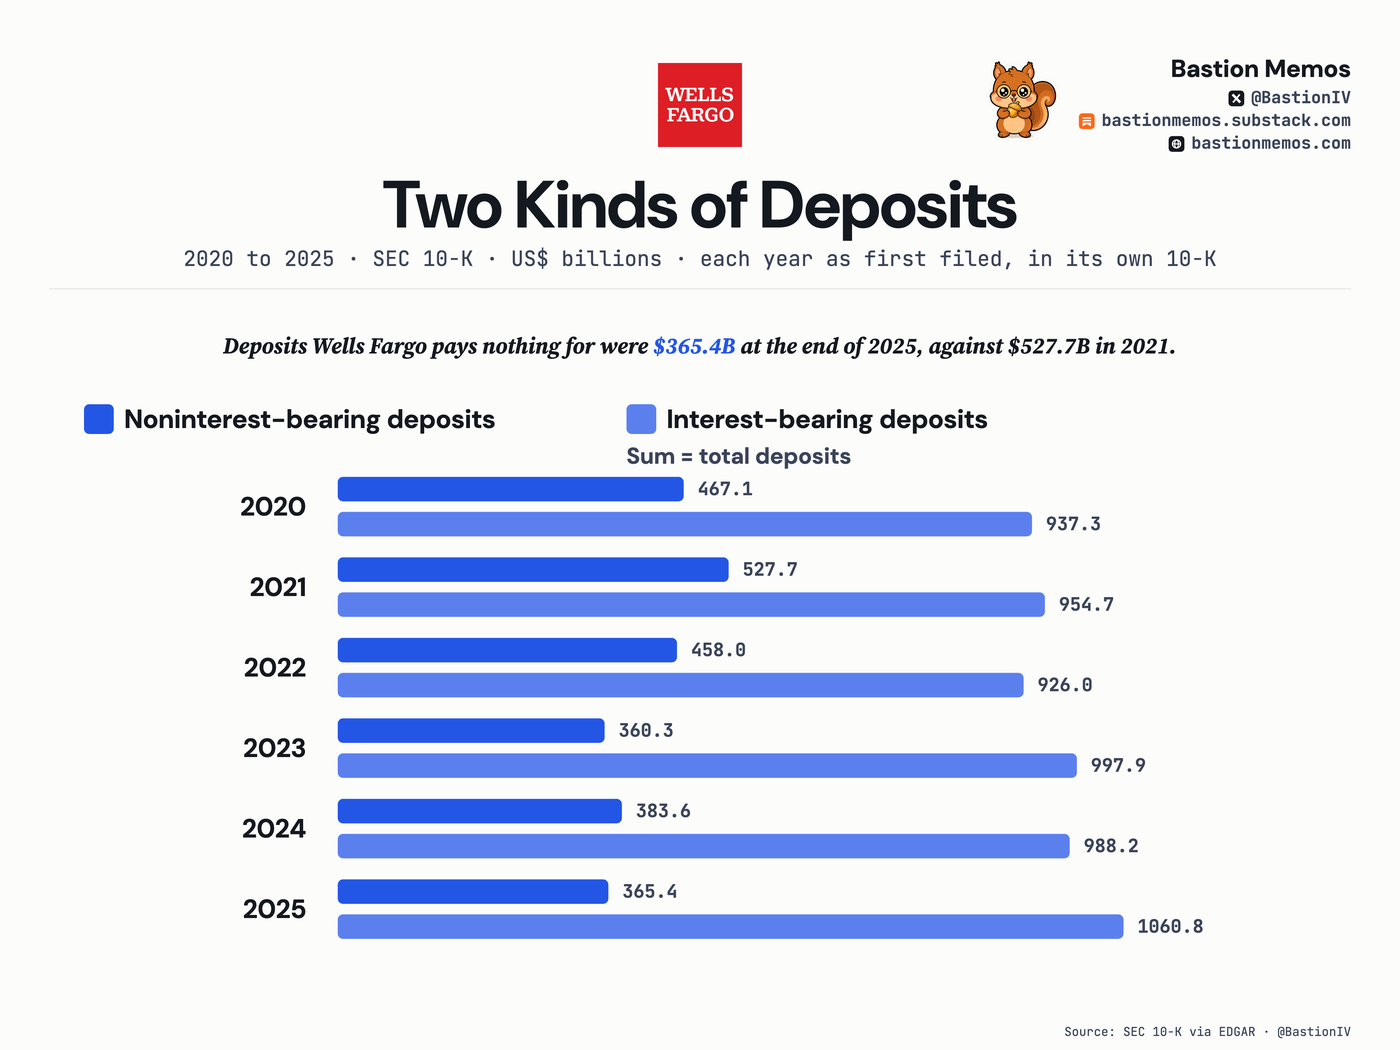
Deposits Wells Fargo pays nothing for were $365.4B at the end of 2025, against $527.7B in 2021.
Both rows are the filer's own deposit lines, and they sum to total deposits exactly in every drawn year. The free kind peaked in 2021; the paying kind has grown every year since 2022.
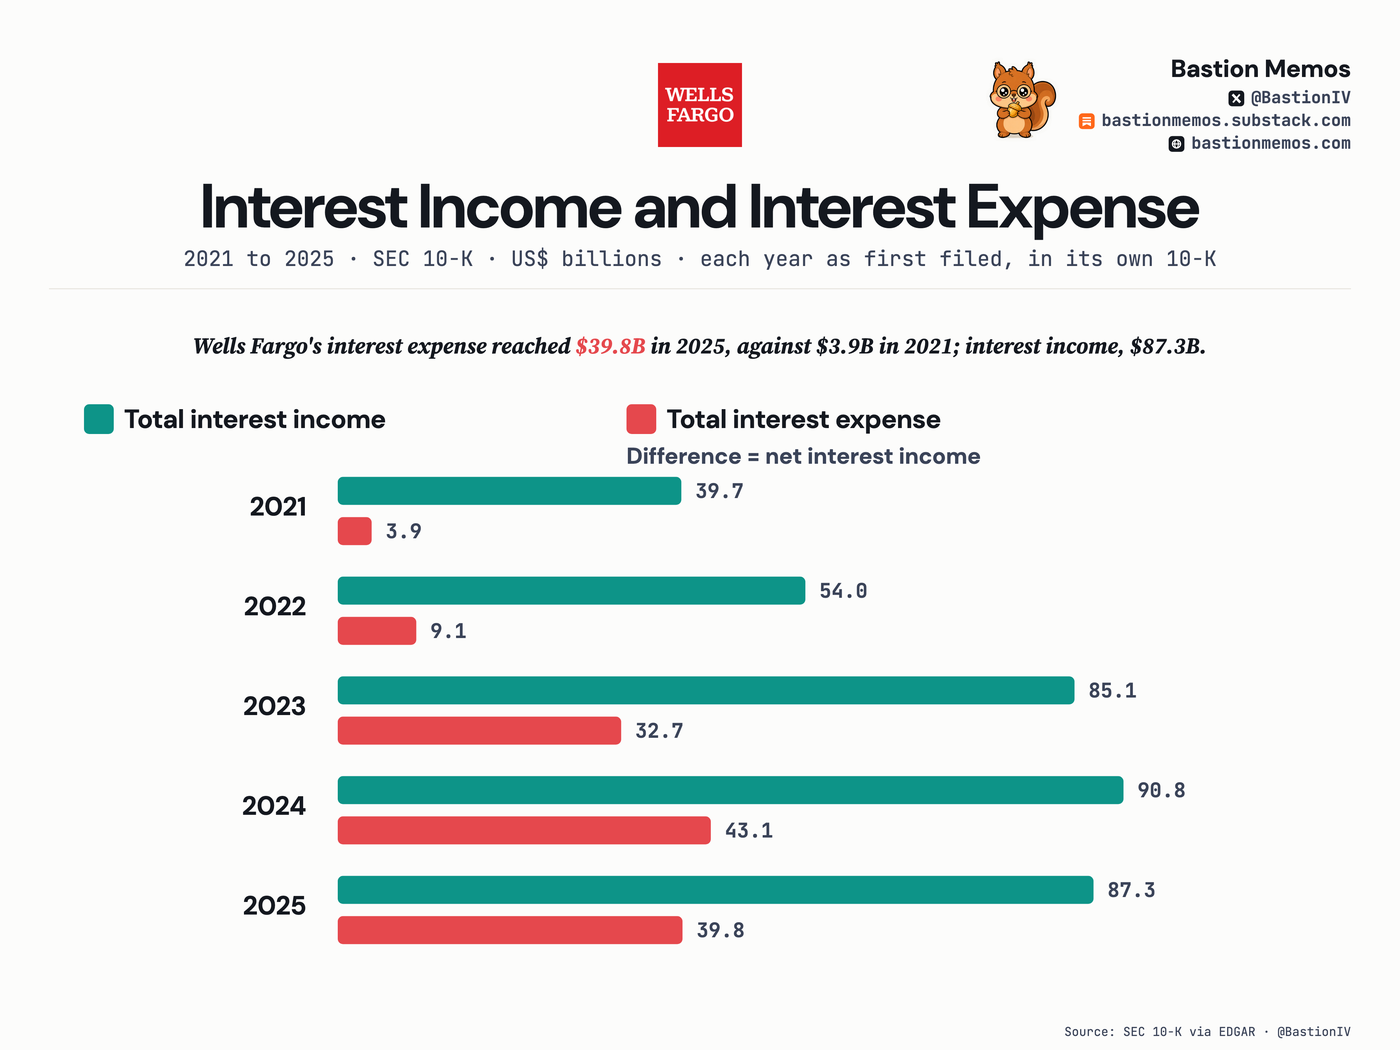
Wells Fargo's interest expense reached $39.8B in 2025, against $3.9B in 2021; interest income, $87.3B.
The two rows differ by net interest income exactly, in every drawn year as first filed. Rate moves show up first on the expense row, which rose far faster than income across the span.
Where the revenue came from
| Segment | Amount | % of revenue | Y/Y |
|---|---|---|---|
| Consumer Banking & Lending | $10.3B | 45.3% | +6% |
| Corporate & Investment Banking | $5.4B | 23.9% | +16% |
| Wealth & Investment Management | $3.9B | 17.1% | +13% |
| Commercial Banking | $3.1B | 13.7% | +6% |
Income statement, line by line
| Line | Amount | % of revenue | Y/Y |
|---|---|---|---|
| Revenue | $22.6B | +9% | |
| Pretax income | $8.0B | 35.6% | — |
| Income tax | $1.4B | 6.2% | +53% |
| Net income | $6.4B | 28.3% | +17% |
— means the filing states no comparable prior-year figure for that line, so we do not compute one.
The filing also prints consolidated net income of $6.6B, of which $238M belongs to outside co-owners of Wells Fargo's subsidiaries (noncontrolling interests, in the filing's words). The figures above are net income attributable to Wells Fargo, the filer's own line.
The last 8 quarters
| Quarter ended | Revenue | Net income | Net margin |
|---|---|---|---|
| Jun 30, 2026 | $22.6B | $6.4B | 28.3% |
| Mar 31, 2026 | $21.4B | $5.3B | 24.5% |
| Dec 31, 2025 | $21.3B | $5.4B | 25.2% |
| Sep 30, 2025 | $21.4B | $5.6B | 26.1% |
| Jun 30, 2025 | $20.8B | $5.5B | 26.4% |
| Mar 31, 2025 | $20.1B | $4.9B | 24.3% |
| Dec 31, 2024 | $20.4B | $5.1B | 24.9% |
| Sep 30, 2024 | $20.4B | $5.1B | 25.1% |
Held by tracked 13F managers
Wells Fargo & Co. (COM): 14 of 69 tracked managers reported holding it — $5,235M across tracked reports, as filed.
13F reports arrive up to 45 days after quarter end and may be amended; totals sum across tracked reports, not unique economic ownership.
Get the next Wells Fargo card when it files — free, one issue a week, no ratings. Subscribe on Substack.
Correction (2026-08-31). For part of today the income table's net income Y/Y read +22%, a comparison against the prior quarter; the year-over-year figure is +17%.